Why You Need More Than Tariffs To Win Zero-Sum Games On The Global Stage
An essay about what it really means to be committed to growing domestic industry & enriching the middle class.
A Summary of This Essay’s Key Points:
The most intolerant wins: global supply chains force production to comply with the most intolerant buyers
Europe therefore dictates the shape of regulatory compliance for global auto markets
This should be an incredible boon to European industry!
Instead, it’s bankrupting domestic industry, accelerating the continent’s deindustrialization, & funding the rise of an adversarial regional hegemon
Electrification’s core physics problems are downstream of energy storage
Battery improvements haven’t moved as fast as Moore’s law: slower rates of tech improvement mean a longer time horizon to market dominance & fewer opportunities for outsize investment returns
China nurtured multiple firms focused on battery development in the mid-1990s, with the goal of dominating the subcomponent market for electric devices
Longer time horizons necessitate profit taking while building these businesses, as no pool of capital would fund 30-year cashflow negative journeys under these conditions
In contrast to China’s multi-decade nurturing of domestic industry, Europe and California wield regulatory cudgels to beat domestic industry into electrification
With 15 years to transition fully away from gas vehicles, large European automakers now invest billions into the only market developing suitable batteries at scale: China
In exchange for battery access, they transfer any remaining IP to the new generation of Chinese firms now building domestic Electric Vehicles atop a fully domestic supply chain
Meanwhile, new startup European EV manufacturers face all the usual European barriers to doing business and struggle to get to market at a competitive price point
After building out all the component manufacturers and reorienting global supply chains to their own firms, China’s Electric Vehicle companies now have large structural advantages over the competition
“Chinese EV makers have opened up vast and unassailable lead in the global market”, says the Wall St. Journal
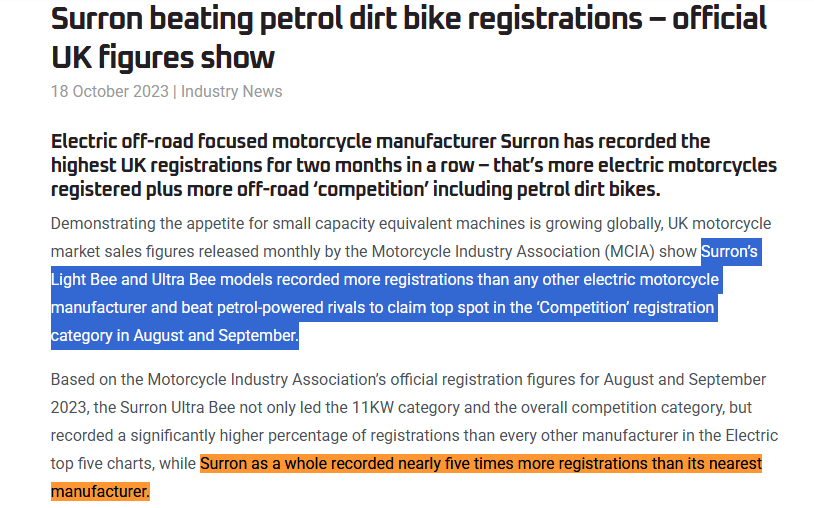
“[Chinese Electric Bike brand] recorded the highest UK registrations for two months in a row.”
Western academics tell themselves this is all to our benefit — higher equity prices & cheaper products make us all richer in aggregate!
But moving industrial production elsewhere reduces the number of viable paths to personal prosperity and increases socioeconomic bifurcation
The youth radicalize while voters oscillate between ever-more-polarized political extremes, searching for someone or something that can “make things feel better!”
Gen Z now thinks you aren’t “financially successful” unless you make $600k — 3x more than Millennials!
Sadly, no matter which flavor of radicalism your nation’s plebeians choose to vote for, it’s guaranteed to make your industrial base less competitive vs. China
At the end of the day, Europe has squandered a generational advantage on its home turf, playing under home rules and biased referees, and used all its bureaucratic red tape to fund the development of Chinese industry in favor of its own
America doesn’t have to have the same fate — and even if we do nothing, we’ll be more okay than Europe
But if we are going to play this game, playing it half-heartedly with a smattering of tariffs is the worst move of all!
This essay does not present an exhaustive list of all the things necessary to win the game — indeed, it explicitly calls out that no such list is possible
What it does do is say: winning is in the space of possible outcomes, so you should know what your competition is doing and choose your next moves accordingly
Summarizing 12k words in a few bullets is tricky, so give me a chance to make my case —
Globalism Keeps Kosher: The Dictatorship of the Strictest Standard
Let’s talk explosions. Controlled ones.
Pictured: a bike powered by internal explosions
In global supply chains, a single uncompromising regulator dictates standards for all. Nassim Taleb published “The Most Intolerant Wins: The Dictatorship of the Small Minority ” a decade ago, noting that complex supply chains opt to make every grocery store item Kosher instead of bifurcating into “Kosher” and “Non-Kosher” aisles.
Lemonade is just sugar & water. But the complexities of trying to accommodate the 0.3% of America who keep kosher would mean pointless duplication for producers & distributors. So most products on the shelves of big retailers will be kosher. Check for yourself next time — there’ll be a little “U” in a circle on your items that stands for Orthodox Union.
Vehicles are a bit more complicated than lemonade. Metal, composites, forging, assembly, global supply chains, dealer networks. They cost a lot more to make per unit.
Which means if one part of the global market — particularly a wealthy part of it like Europe — enacts stricter regulations on internal combustion engines, the whole production chain will shift to accommodate them.
If you want to buy a bike in America, your choices will be determined by European regulations.
KTM Case Study: Trouble in Europe
With over 4,000 internal employees and a global dealership network, KTM is Europe’s largest motorcycle manufacturer. Revenues are over €2.5 billion.
You might think they’d be doing okay…
But unfortunately their primary product is a two-wheeled internal combustion machine.
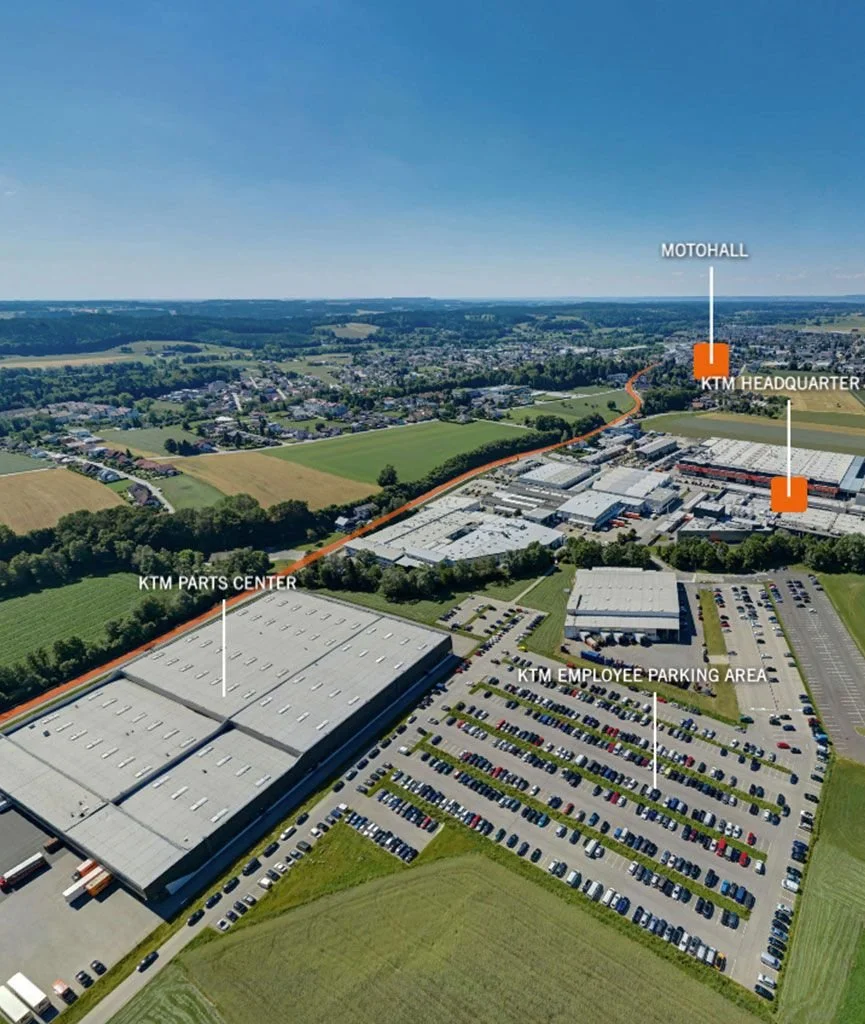
Pictured: a nice day in the life of a KTM factory worker
And so KTM is put in the awkward business position of trying to shape the market by launching new products into a regulatory environment that then makes those new products illegal.
For example, their Street legal 790 Duke was a big success when it released in 2018. It was made illegal for sale in Europe in January 2020:
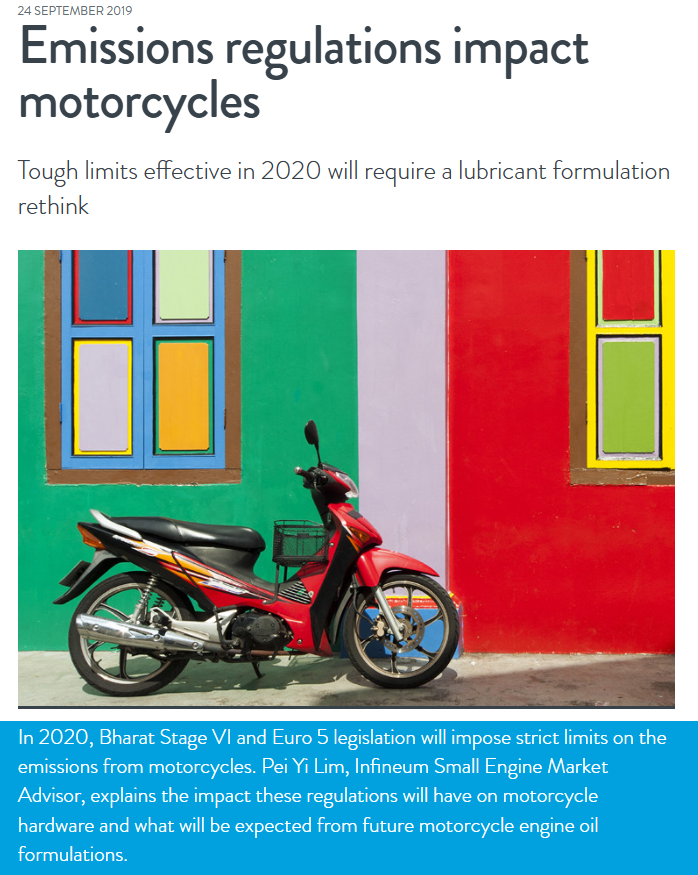
[New rules] required updates to on-board diagnostics (OBD stage II), including misfire detection and oxygen sensor monitoring. There was just one problem for KTM. With new regulations set to take effect in January 2020, it hadn’t yet developed a Euro 5-compliant 790 Duke.
You do not need 15 years of in-industry experience to intuit that <18 months from launch to banning is not ideal for the lifetime of an industrial product with a complex supply chain.
Some readers may now be thinking: “It’s fine, they can just invent a cleaner way to burn fuel.”
But of course, they just gamed the rules by making the engine bigger:
The displacement bump achieved two objectives. Larger mills generate more power at lower engine speeds. Thus, producing less emissions without sacrificing output.
This essay isn’t about the emissions. I assume many of my readers are broadly supportive of efforts to make transportation cleaner.
It’s about industrial development.
In the context of actually trying to build and run a business in this environment, the reality of complying with European regulatory frameworks is that:
Your products must get more expensive for consumers
Your product lifecycles have to shorten
Your actual solutions aren’t necessarily going to be cleaner
Your fixed costs will rise as you attempt to comply
None of these things increase the profits you’ll be able to make. Without profits, your ability to invest in future improvements shrinks to zero.
How do you mitigate any of this as an industrial manufacturer?
You need to race towards bigger economies of scale!
You need to 10x your revenues and 100x your employee count, so the reduced-profit-per-unit is minimized and your lobbying efforts can have more impact shaping the regulations.
Of course, you don’t need a business degree to know that increased fixed costs crush small manufacturers. Mega manufacturers can mitigate the cost impacts and strong-arm regulators. Banks or bikes, the solution to regulations that raise the fixed cost of doing business is always going to be the same: size is the prize.
Anyway, here’s the punchline:
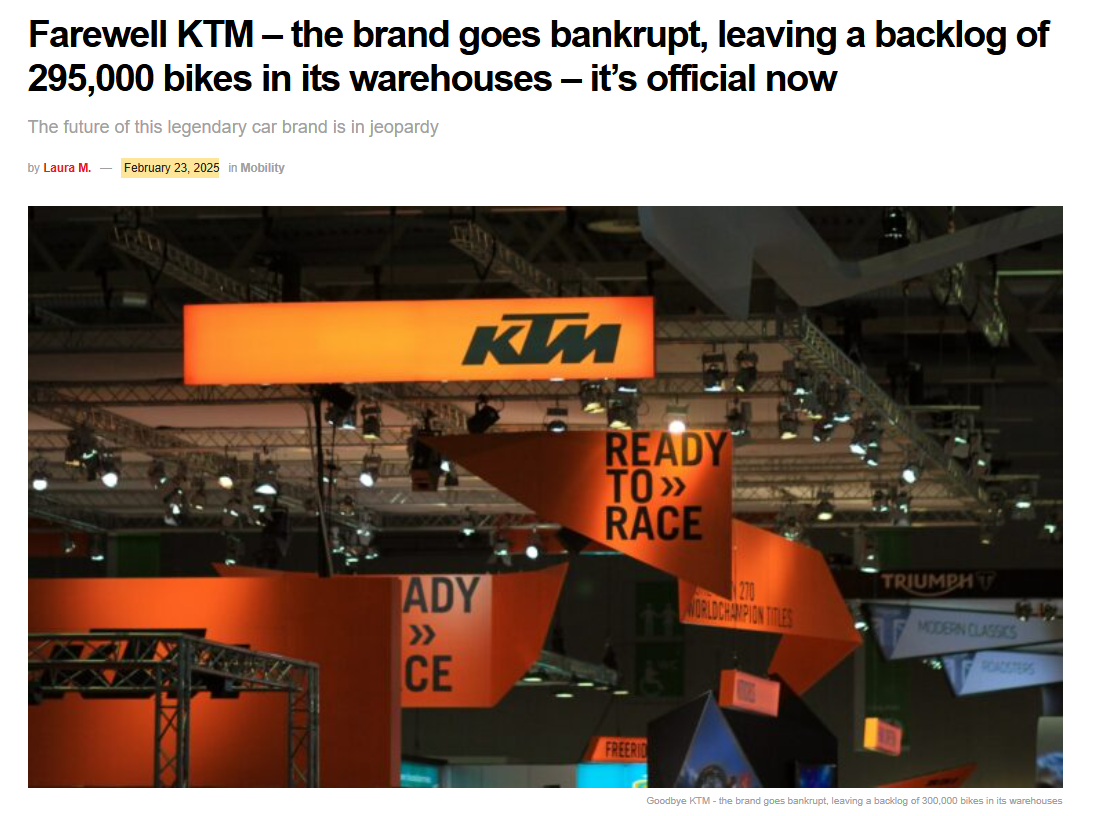
“On November 29, 2024, KTM filed for bankruptcy.” Thanks, KTM, for finally inspiring me to write this essay.
Mission Success.
We did it team!
Has KTM been mismanaged? Certainly. Perhaps legendarily so. But you have to understand the underlying incentives pushing them to try and capture as much market share as possible and get to the next tier of industrial scale.
Was giving their business a set of operating incentives that pushed them towards sustainable economic growth and increased employment a concern for their own government?
Clearly it wasn’t a priority. But was it even a consideration?
How much time did regulators in Brussels spend thinking about the 4,000 jobs in Mattighofen, Austria and the effect of €2.5 billion in revenue flowing through a company headquartered there?
Electric Dreams: Small Beginnings, Happy Endings
Electric powered vehicles have been a reality for decades.
My dad brought me home a toy RC car 30 years ago. It ripped.
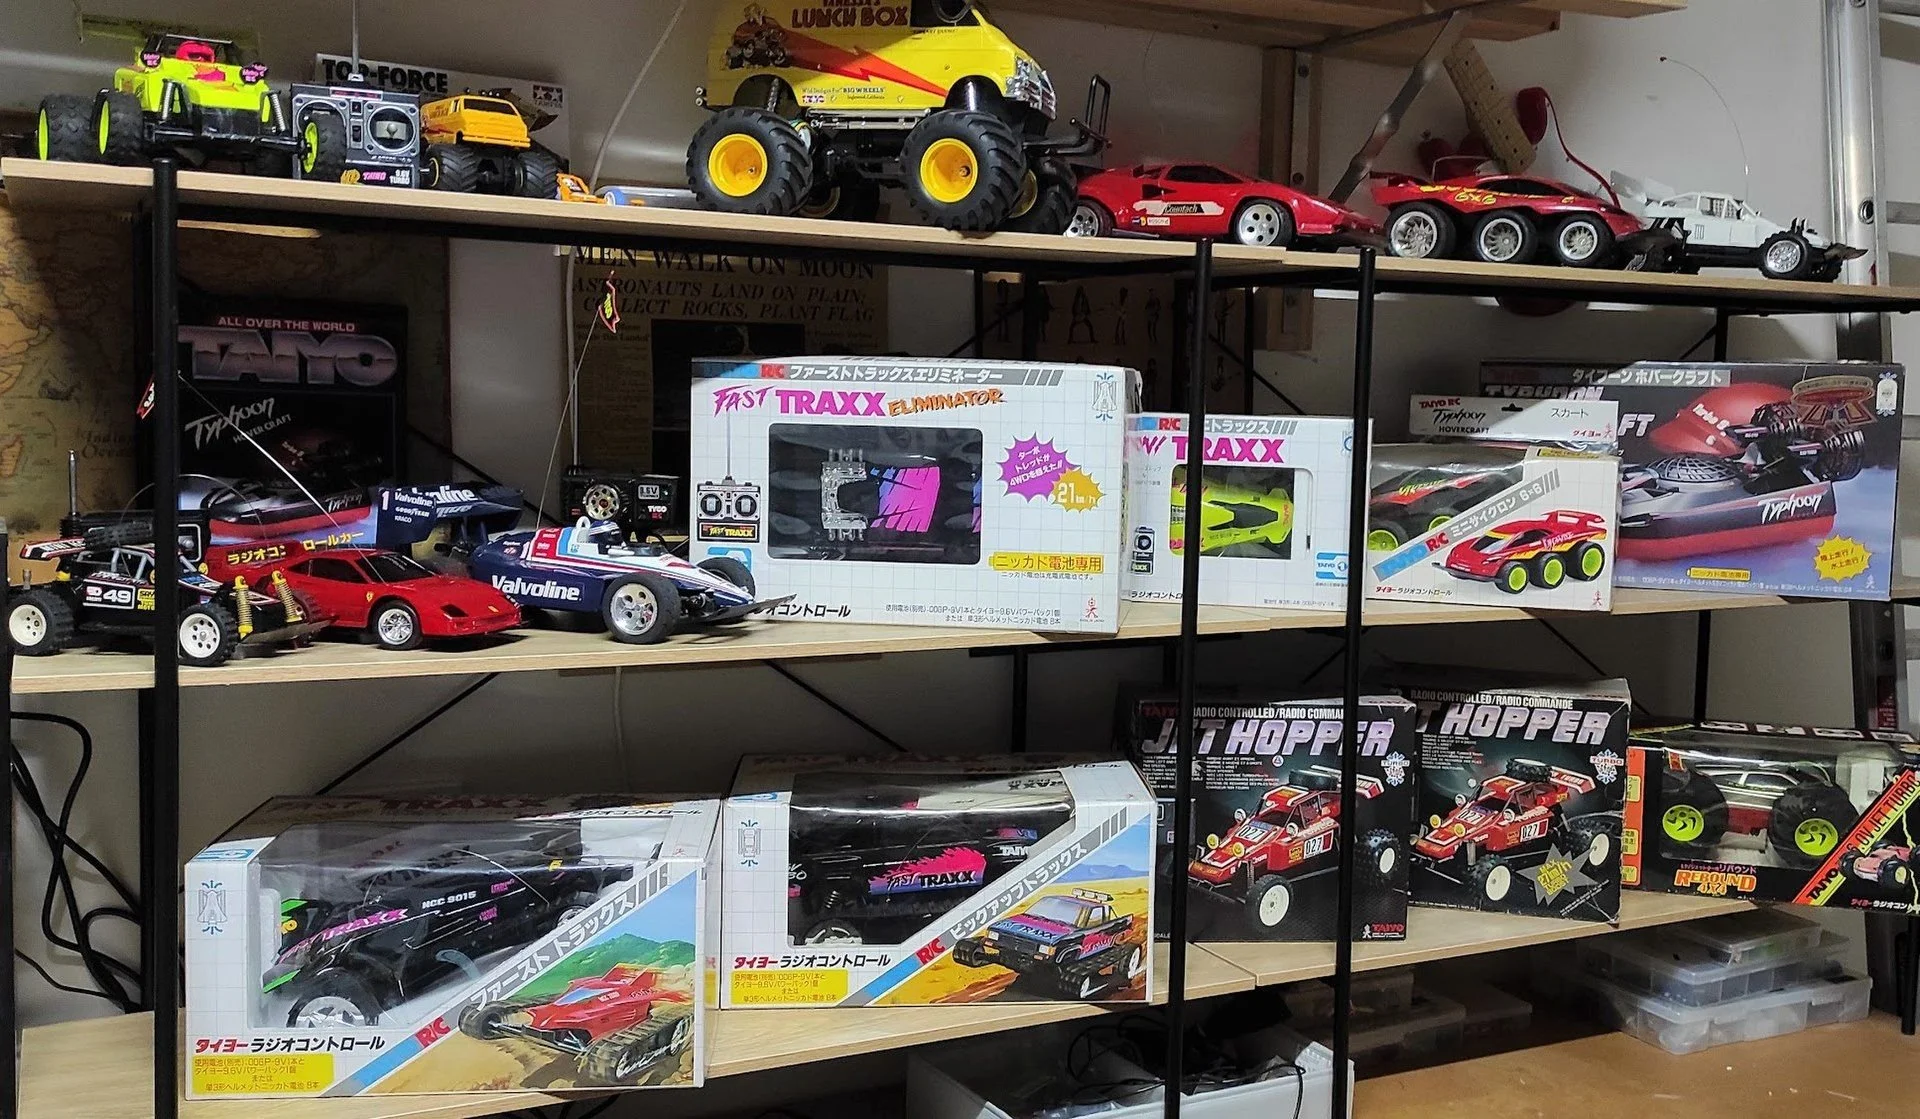
You may have grown up with one of these!
But not every Tech revolution runs at the same speed.
“We wanted flying cars, instead we got 140 characters,” is a great quote. Moore’s Law doubled computing power every 18 months while battery energy density was only doubling every 12 years. That’s an 8x gap. It’s a lot easier to make money investing in something that gets twice as good every 2 years — incumbents aren’t as much of a threat and you can ride a technology wave to scale.
High cost, low energy density batteries are why my toy electric car could rip around at incredible scale-accurate speeds but scaled up versions were still decades from mass consumer markets.
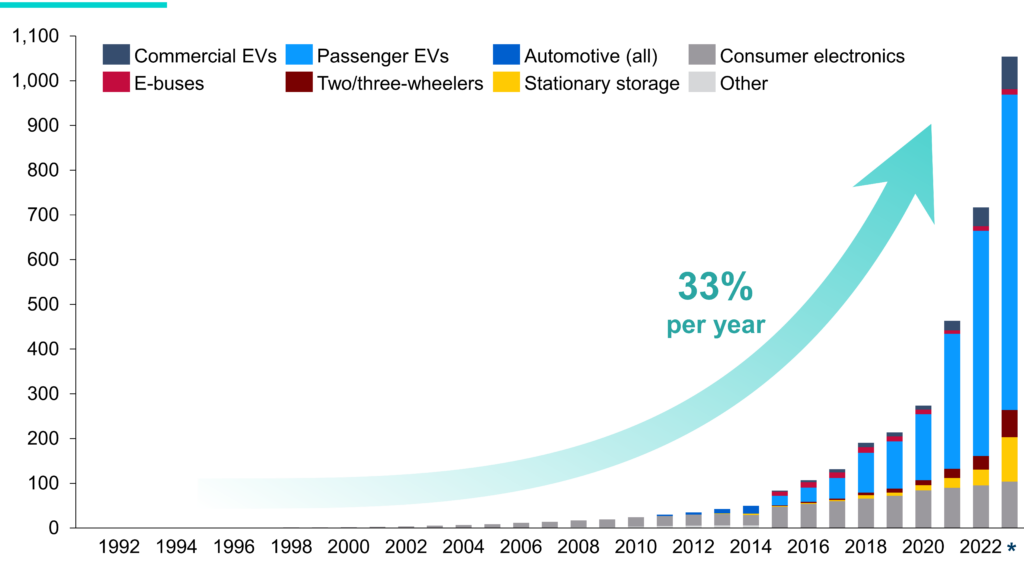
Observe the depressing flatness of the dark blue line for 25 years:
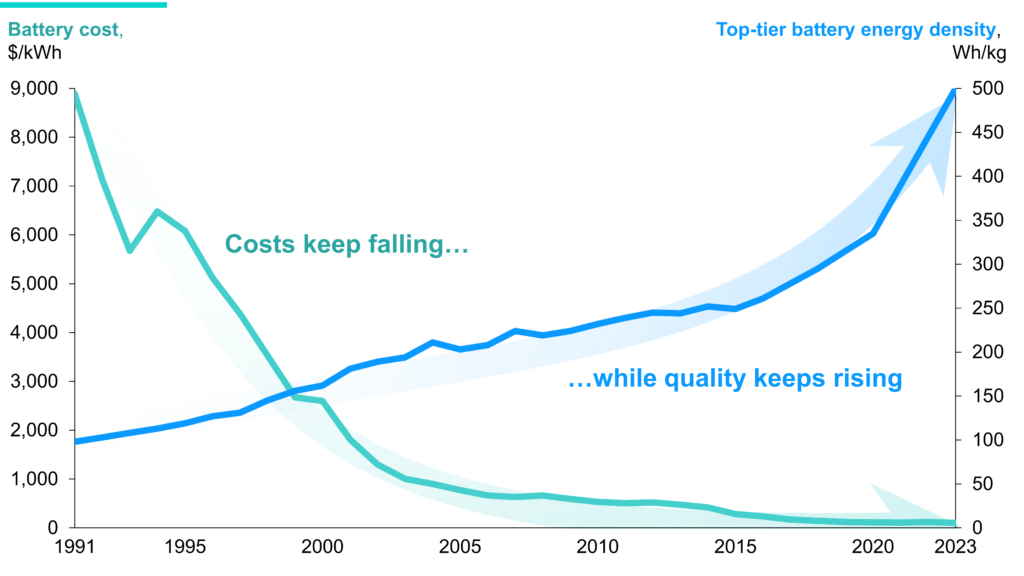
Pictured: a dark blue line showing battery energy density that is flat for 20 years and then has a dramatic positive spike in the last 3 years (source)
This chart presents an obvious question: why did things spike recently? Is it just a faulty data set?
But no, you can find similar data elsewhere:
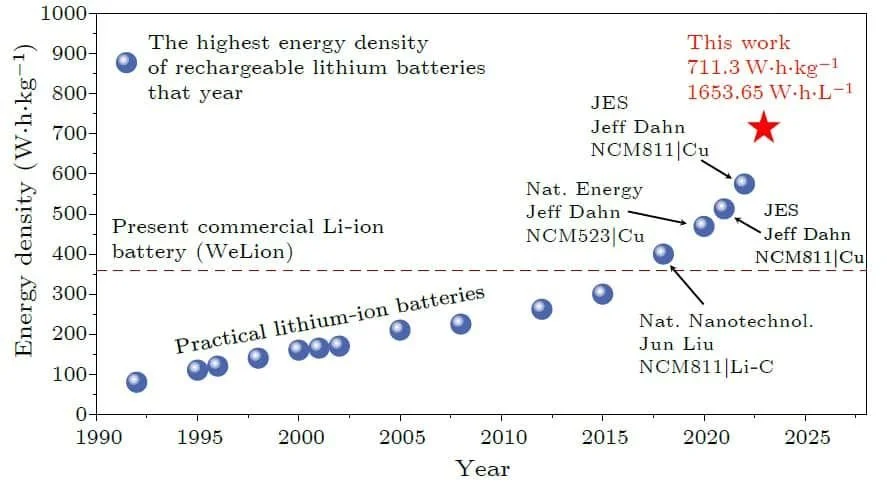
Similar data, with the most recent advancements courtesy of Xiqian Yu and Hong Li of the Institute of Physics, Chinese Academy of Sciences in Beijing (source)
These things are somewhat overdetermined. Many different factors that contribute to technological improvements.
The short version[-1] is that the tech crossed the “good enough” threshold to start attractive a whole bunch more human & financial capital, in pursuit of electrifying vehicles:
Dramatically more attractive products (EVs) as a result of underlying technological improvements, themselves a result of multi-decade investments centralizing Capital, Labor, R&D etc.
Why am I talking about batteries?
Because the technological improvement curve moves slow enough you can track it. It takes longer than any one political administration. It requires a level of sustained capital investment that only makes sense if you’re able to take profits along the way. And then once you hit “mass market EV-suitable” products, the available capital flows 5x and everything goes to the moon.
You can’t snap your fingers in the year 1995 and say: “make me an Electric scooter that can carry an adult human male 25 miles at 20 miles an hour and that can retail for $400-$500 profitably.” No amount of upfront investment can deliver that product before all the available human and financial capital is depleted.

Pictured: a device that can, sort of, theoretically, carry an adult human male for ~25 miles at speeds above 15mph.
But 1995 is when LG started investing billions into its Nanjing facility. And it had to ride the consumer laptop boom to be able to deliver the micro-mobility boom of the mid-2010s. And now true next generation mass market affordable EVs are coming.[0]
The Electric Platform: Winning Under Uncertainty
There’s something I want to callout before we look back at Europe. The Chinese industry news site I linked in the footnote detailing the buildout of LG’s $8bn Nanjing battery facility explicitly called out the total value output of all the regional businesses enabled by LG ($18b) at the very top of the article. This is a perspective you’ll find in academic journals elsewhere, but it’s not one that comes naturally to modern Western readers. I wrote about how Google essentially created the entire Open Internet ecosystem, but most people who cover Google don’t include the revenues of all the businesses made possible by Google’s Internet ecosystem in the very same sentence as Google’s own revenues!
“What are you saying, Conrad? We should value Google stock based on revenues it can’t conceivably capture?”
“No, I’m not saying you should do that. But a wise government official might want to know the second and third order effects of having a key part of an industry’s ‘supply chain’ operating healthily within their borders, as well as have an accurate count of how many people and taxes are downstream of a few central nodes in their network.”
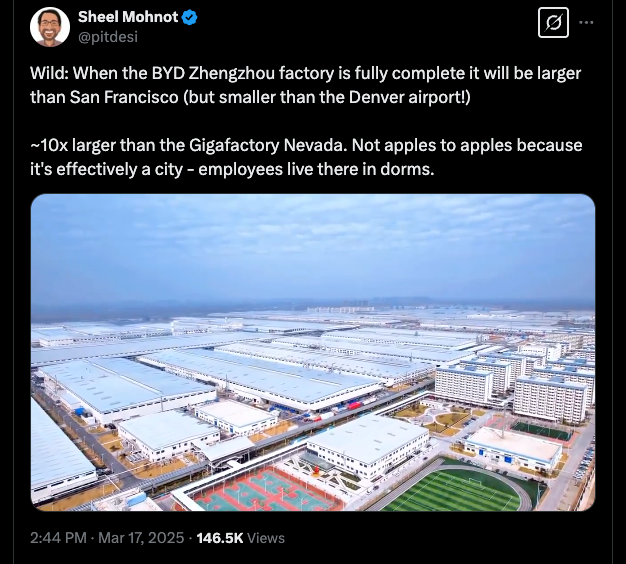
Thriving industrial development is not JUST about the big players in a space. There are clear network effects in manufacturing when sufficiently large players move into or out of a region. The single pretty giga factory is nice, but the broader array of suppliers it requires is even nicer.
It’s about building a Platform. A Platform economy.
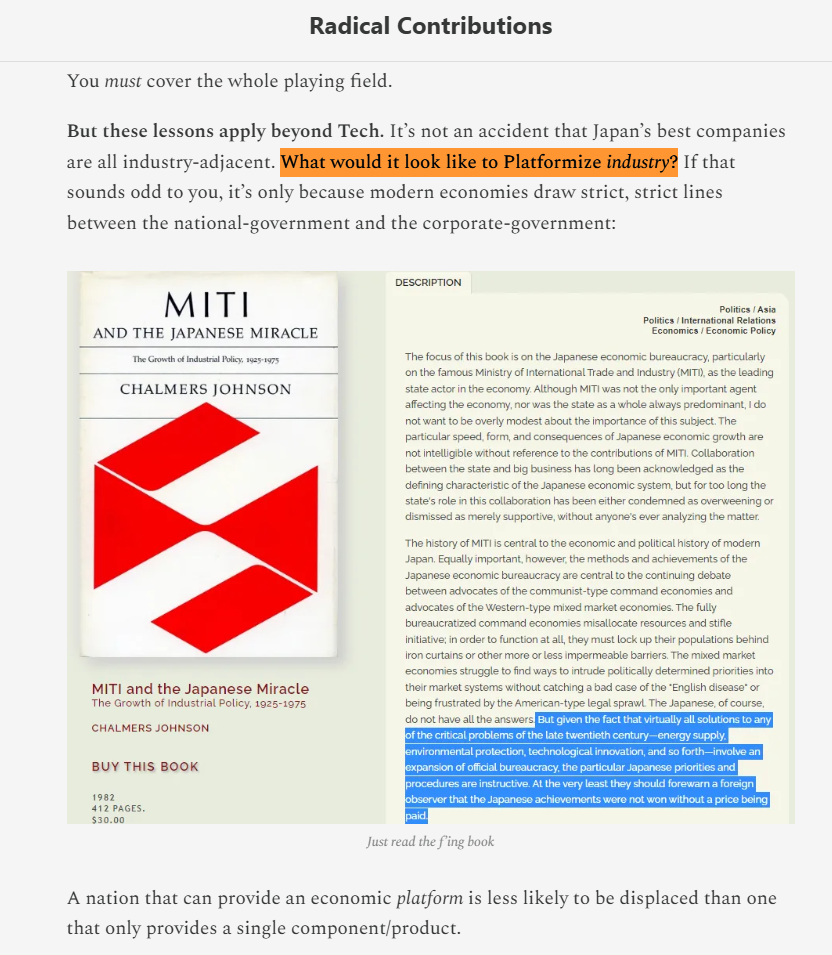
A “Platform” is so much more than a nifty website (source: American Zaibatsu: Macroeconomics for Tech Employees)
The Happy Ending for Electrification isn’t just “mass market consumer EVs.”
It isn’t just “novel high density battery technology gets developed.”
It isn’t just “30,000 jobs created by one firm.”
The Happy Ending is the whole package and what it unlocks in the next stage of the game. The Platform. The ability to have a thriving ecosystem of Industry, with hundreds of small players alongside international megacaps, that can combine and recombine foundational technologies into market ready products no matter what wave of innovation comes next.
You can’t predict the future. You can’t predict the next wave.
But an Industrial Platform positions your regional economy to be able to ride it anyway, employing hundreds of thousands of people productively along the way.
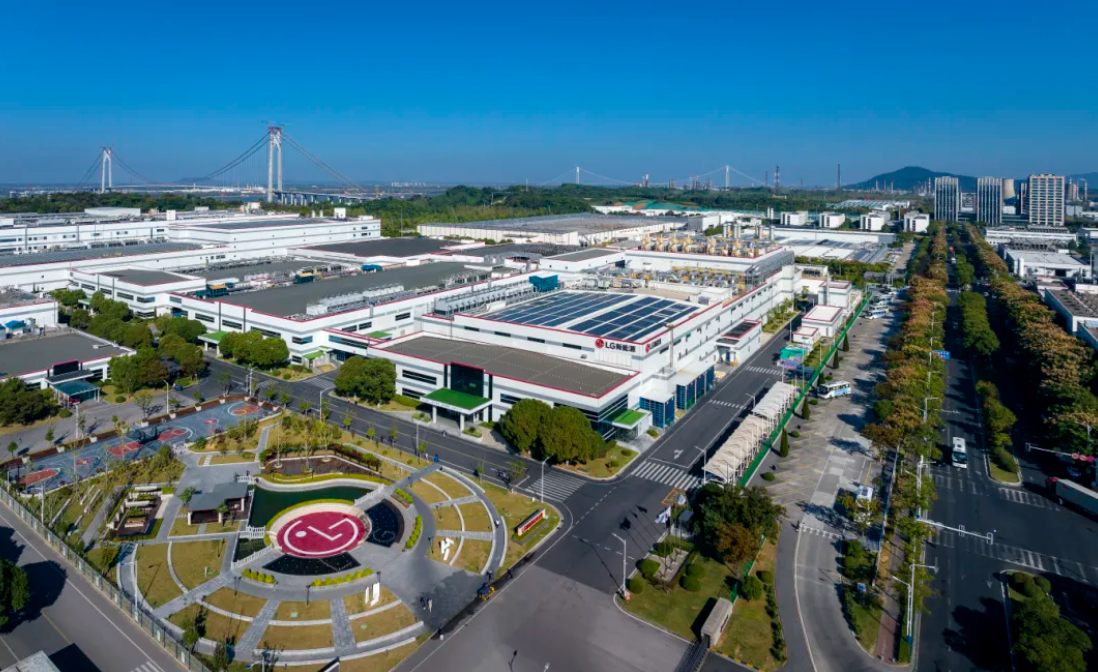
You too could work at LG’s Nanjing HQ!
Now hopeful that I’ve made my point about how an integrated regional manufacturing hub requires multiple firms operating at different levels in the value-added stack, an attractive regulatory environment, favorable tax incentives for Capital, strong wages for Labor, and so on, I close some browser tabs and move on. The last tab is the /about page for the aforementioned foreign-language Chinese industry newspaper. I click it, curious. The first paragraph cheerfully explains:
We aim to help promote the industrial upgrading of Chinese auto supply chain.
I chuckle. I wonder which newspapers would put a sentence like this at the top of their /about page in the West. I suspect I have not even come close to making my point. I’ll grant you that of course it’s all propaganda — but ask: did it occur to European leaders to invest any of their own propaganda points in “promoting the industrial upgrading of Europe’s auto supply chain”?
Why not?
European Self Sabotage: Big Beginnings, Sad Endings
Where China’s Industrial Platform focused on foundational technologies and supporting a dynamic ecosystem, Europe has chosen a…somewhat different approach.

“Nothing can stop BMW from building electric now!”
California led the way, but Europe is looking to one-up them.
The KTM Case Study above is a tiny slice of life. I could write 10k words on that section alone. Someone should write a book on it. There should be a whole section in your nearest bookstore dedicated to Industrial Decline and the inevitable corporate response of increased centralization and oligopolistic market stagnation to regulations that lower profits — and the way this slow motion train-wreck can always be cast as mismanagement for any single company who fails in such a hostile environment.
Alas, your nearest bookstore probably doesn’t exist anymore either.
The total banning of gasoline powered cars by 2035 is an aggressive attempt to shift the industry to a less-carbon future. And while you should be familiar with what it truly means to become “Data Driven”, the reality of the real world is that most organizations — including governments — operate hierarchically and focus their attention in a top-down manner on the things that are easiest for them to measure and understand.
Patrick McKenzie told tech workers in 2012 that their while their personal paycheck is the largest regular flow determining their net worth, it’s actually the smallest possible unit of money that their employer interacts with on a regular basis.
So when European bureaucrats want to accelerate the transition to electric powered transportation, the smallest possible unit of their society that they can interact with is called “BMW” (Enterprise Value: $100b).
So they take Mr. BMW and they sit him down and they tell him that if he sells any non-electric cars they are going to shoot him. He protests. He asks for some time to comply (15 years). “Who the f-ck makes batteries and how do we get three million of them a year?”, Mr. BMW asks his senior executives (the smallest unit within his organization that he can interact with).

European regulators explaining to each other their plan to make BMW build electric cars
Do you see his problem? In light of everything I’ve written above? Where is the domestic industry he can pull from? Why did LG spend $8 billion building out more battery production capacity in China than it built out in its home ground of Korea? Why didn’t it pick Germany? Mr. BMW has 15 years to figure out a problem that’s taken, conservatively, a hundred billion dollars of capex and a million people’s careers to solve.
And all those careers and all that capex was profit-taking along the way. Not a LOT of profit. But enough to keep reinvesting surplus US dollars into additional capex in China.
Just picture the pricing negotiation Mr. BMW is going to have to go through to source high quality electric components at the scale of 3 million vehicles per year — and that’s at current annual production volumes! I’d hope they expect to grow between now and 2035. He’s gonna need 5 million batteries, at least!
So what does he do? Business, of course. He re-ups on his joint venture with the State Owned Huachen Automotive Group Holdings Co. Ltd. (the only allowed distributor of his vehicles in China), building the largest R&D center outside Germany and doubling production capacity at factories in Shenyang to 650,000 cars a year.
With his dues now paid in the form of direct Capital and Intellectual Property infusions, Mr. BMW is then permitted to form a new joint venture with Mr. Mercedes to roll out 7,000 charging stations over just 2 years.

In this deal: you give me money & IP, I give you open access to build whatever you want wherever you want to test your products in a lower-safety-standards environment before you have to bring them to market back home in Europe
Europe’s approach to Electrification was — and continues to be — top-down punitive mandates imposed on their largest manufacturers.
Motorcycles must comply or die.
BMW needs to electrify or die.
But while passing all these mandates, no thought is spared for what it would take to build a replacement Platform Economy that can support and grow domestic industry.
European regulations are the kosher of Industry. Everyone complies with Euro standards to reduce duplication. They are the most intolerant!
And yet. They don’t care who gets richer or who ends up with the jobs, so long as the cars are cleaner. And so…
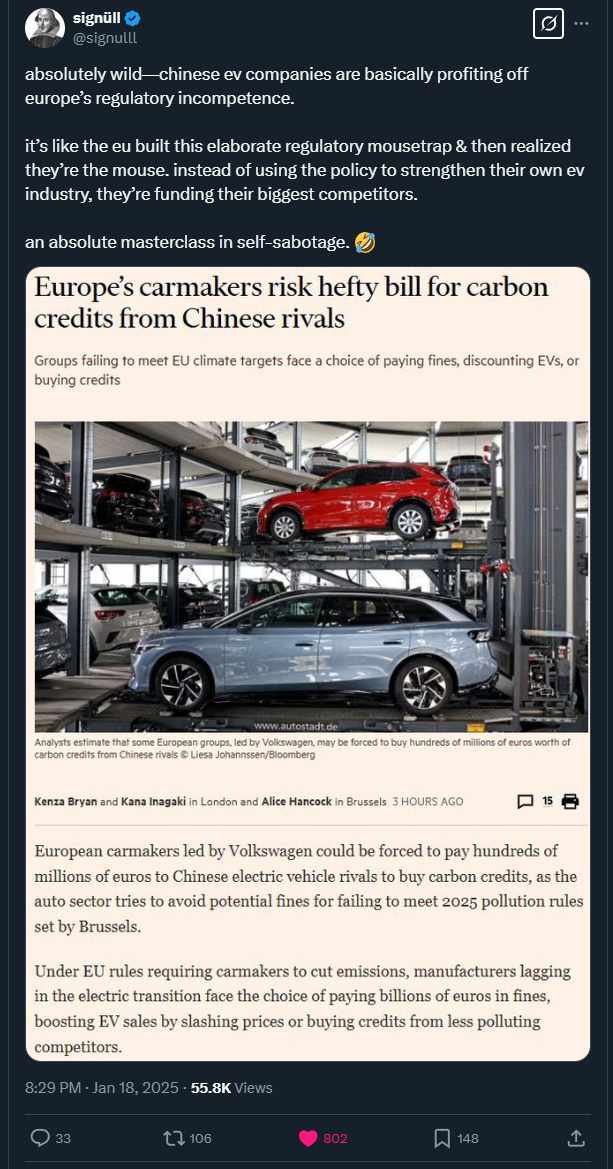
When you truly understand the multi-firm multi-decade multi-city scale of the economic opportunity that was lost, you will struggle to avoid radicalization when it comes to viewing European leaders as competent (source)
Guess who those naughty European automakers now have to buy carbon credits from?
You wouldn’t believe it if you read it in fiction.
Protectionism Without Production: Salt In The Wound
Europe uses high standards and strict rules as a source of competitive advantage – a form of vanilla protectionism that favors domestic industry. EU Single Market rules then raise the effective cost of imports by making outside goods comply with EU-wide specs and tariffs, while promoting free trade within. The positive currency impact of the Euro on German exports is massive.
However, unlike classic mercantilism or China’s current approach, Europe’s protectionism isn’t fond of nurturing new businesses to compete in the global market.
It’s all stick, no carrot: mandates, not manufacturing.
I assume this is downstream of needing to shape domestic policy in response to democratic pressures. Voters everywhere in the West hate cronyism and explicit pro-Capital incentives. So Mr. BMW gets the stick and new entrepreneurs move to America. Or perhaps it’s just culture.
In light of KTM’s plight, consider the Stark Varg — a true European Union wonder! A Swedish founder who moves across the EU to Spain to start a domestic industrial manufacturing company building fully electric high-performance dirt bikes.

Stark Varg MX - “The fastest electric motocross bike in the world!”
KTM is stuck with a quarter million bikes it can’t sell due to emissions regulations (the stick).
But perhaps Stark has a different relationship with the government, as a producer of the future?
Cue its founder talking on a podcast last month:
…some ridiculous things like government licenses and stuff like that that you're depending on. The bureaucracy…it's interesting, you know? Sometimes it feels like the the government is trying to stop you from making tax revenue. You're doing your best to you know make more money for them and they're doing the best to to stop you from that.
So that’ll be a “no,” then?
Large companies can often absorb these sorts of compliance costs, but they really can be the nail in the coffin for smaller firms and would-be startups. When your business margins are thin and the path to profitability narrow, every minor speed bump is existential.
The outcome of Europe’s Stick-only approach to industrial policy is yet more pressure towards achieving economies of scale as fast as possible — or towards shifting revenues, profits, and labor to state-protected foreign firms.
Losing To Sur Ron: A Cleaner, Poorer, Future
Stark isn’t the only company trying to eat KTM’s lunch with a fully electric dirt bike.
Take a look at this offering instead:

Pictured: a “Sur Ron” fully electric dirt bike that looks like a glorified mountain bike
Compare it to the Stark Varg above. You don’t need to know anything about bikes. What do you notice?
It looks more like a traditional mountain bike. It looks lighter. It looks a bit cheaper.
The Sur Ron is the natural evolution of Chinese engineering & technology. It’s an outgrowth of micro-mobility electric scooters — very directly, it turns out [see Note 0].
In contrast, the Stark Varg is an attempt to start at the finish line with something that looks and performs exactly like a traditional dirt bike.
The Sur Ron isn’t as good as the Stark. But it costs half the price and goes 60mph.
And so:
Cheap & easy beats everything else
They sold more of these in the UK than any other manufacturer in the category — gas or electric.
Of course they did! Consumers love a product that gives 70% of the value at 50% of the price!
The first Sur Ron bikes launched in 2018, and once they found Product Market Fit they were quickly followed by two copycat brands: E-Ride Pro and Talaria.


Neither of these two bikes above are Sur Rons, but you’d be forgiven for getting confused because they look exactly the fucking same.
And if you’d like to launch your own copycat brand, the factories that make these bikes will make it super easy for you!
You need only reach out to one of the factories — mostly located in Chongqing, China — and they’ll be happy to tweak the design slightly for you and ship you 500 units. Your ecommerce dreams are just one click away!
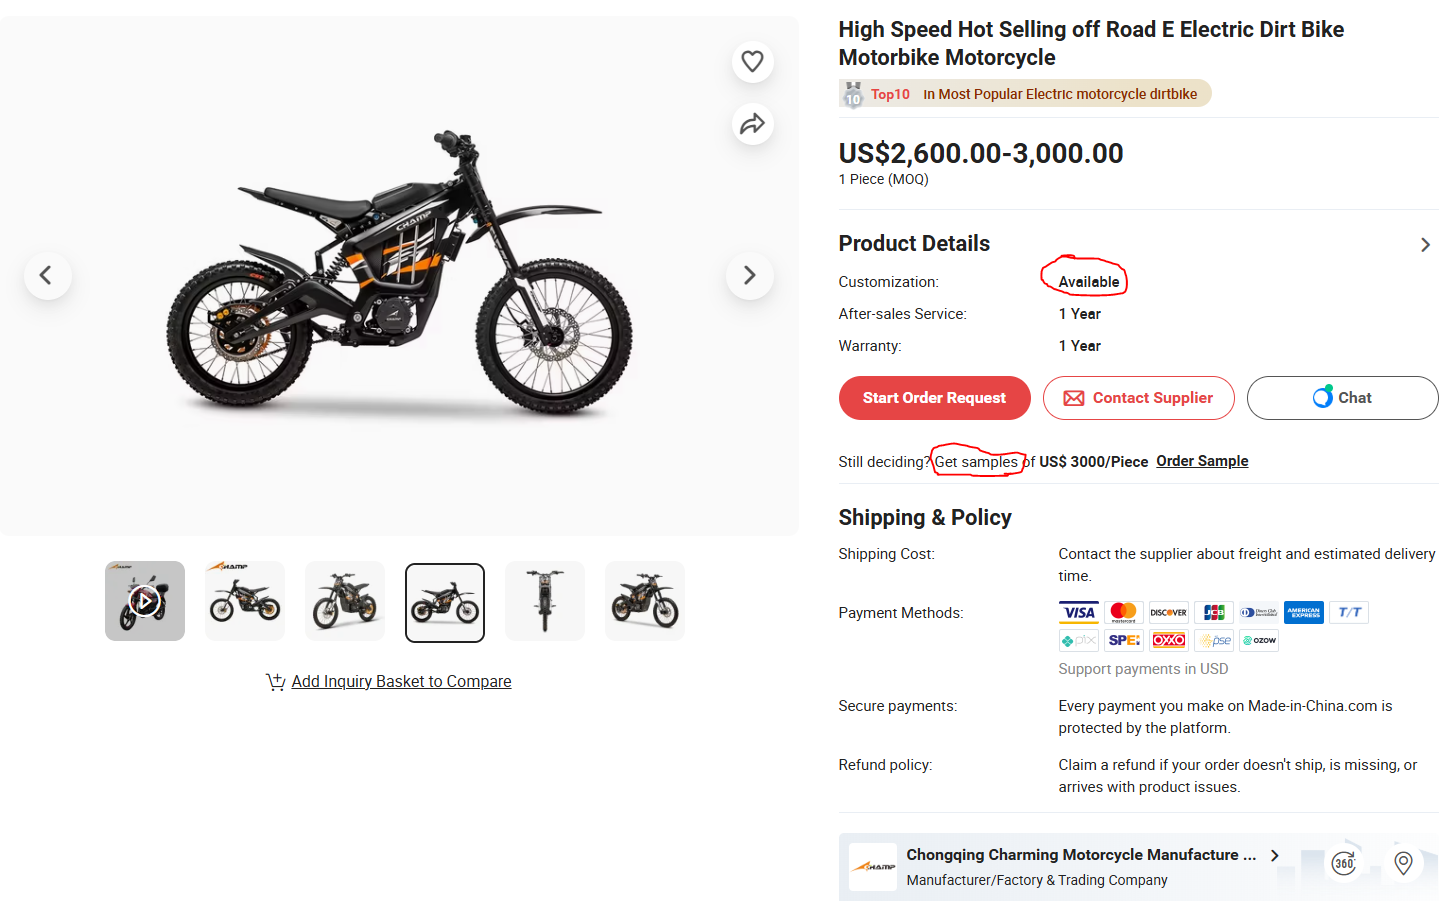
[no source because i am not actually shilling this company]
The key component of Chinese industrialism in this industry is not the “brand”, who just slaps their label on a slightly-tweaked design and manages Go-To-Market.
The key component is the factory that churns out the end product — a factory that has no qualms about “IP” and that views “producing as many products as possible, as efficiently as possible” as its raison d'etre.

This is of course much bigger than bikes. The downstream impact of “every hardware innovation you want to make has to be built in China, where it will then be copied and resold before you get your own test products” on Western innovation and hardware startups is left as an exercise for the reader to consider (source — 10 years old). Also posed is a rhetorical question: do you think BMW & Tesla were unfamiliar with this story when they built Chinese factories?
Personally, I think the Stark Varg is pretty cool, although as an American citizen I’m rooting for America’s own domestic attempt:

The American-made Dust Hightail! Reserve yours today! source
But both this and the Stark will cost you $11k.
When foreign rivals can either meet or route around elevated regulatory burdens and still outproduce you, at 1/3rd of the price, are you really winning?
The Dragon’s Forge: China’s Full-Court Press
There’s a funny meme on twitter about Chinese propaganda aimed at demonizing America accidentally making America look insanely cool. I don’t want to accidentally do the essay version of that here.

Cool af tho
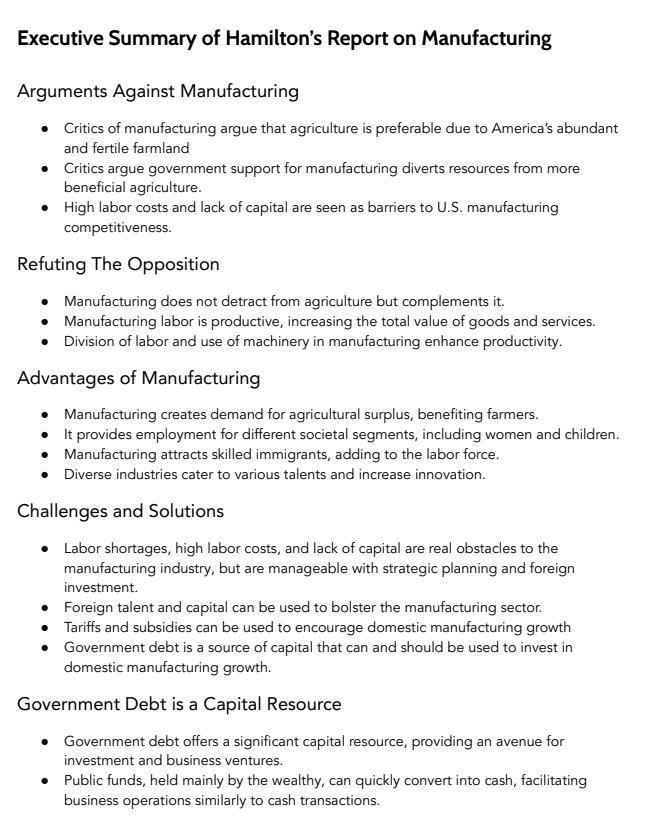
But I do want to pull these threads together. If it makes China look good, so be it. They deserve kudos for playing the game better than anyone else. I can write about how Alexander Hamilton codified the rules of the game 250 years ago ‘til I’m blue in the face — actually executing and adapting to the meta matters far more.
In the battery sector, China founded multiple manufacturers (BYD, CATL, EVE Energy, CALB and more) in the 10 year window between 1995 and 2005, supported by state subsidies and intense local competition. Instead of one big Electric Vehicle maker, China went upstream and built the largest companies in every industry that provides key Electric Vehicle components to manufacturers downstream.
Then, also, incidentally, it built a number of Electric Vehicle manufacturers.
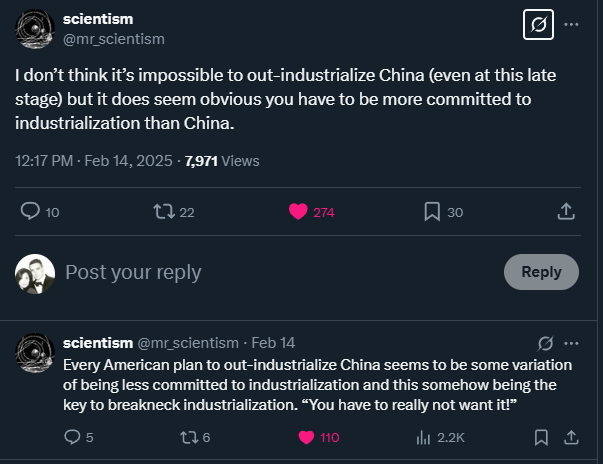
“Making things is good,” reified source
Figuring out how to build a high quality consumer EV is a hard task. But every major European, American, Japanese, and Korean automaker has already done their deal with the dragon. Their IP is only “protected” in the sense that Chinese automakers agree not to sell direct clones of their cars under the same brand name.
But they don’t need to do that anymore!
They have their own brands now, innovating on their own, releasing actually good products at low prices thanks to….everything I’ve been talking about here.

Read the mainstream sources instead if you think I’m too cynical
Using state capacity to direct Capital and Labor into foundational industry and then clear regulatory and tax burdens for the new firms is the first move in the multi-decade play. Cultivating a fleet of national EV makers and letting them battle domestically for market share instead of choosing a winner by diktat is the next.
The redundancy in manufacturers at this stage is a feature, not a bug: a dynamic industrial base with multiple players keeps the market agile and forces firms to push for more innovation. You’re not picking winners and losers like a failed Soviet imitation of Capitalism.
You are literally doing Capitalism: accumulating as much Capital as possible.
Then economies of scale start kicking in. Huge demand from the now-wealthier domestic economy comes online — with many of the individuals driving this demand either directly employed in the production chains that make the whole thing possible, or else downstream of it in services labor. A captive market of increasingly wealthy consumers is an insane asset for any nation. Ensuring your own people are involved in the production chain of global value added manufacturing is a cheat code for getting there.
Of course, there are also currency controls in place. Of course, there are import tariffs. Of course, the actual equity ownership of these firms is shared with the state. Of course the laws themselves are somewhat vague and corruption happens arbitrarily. Of course, attempting to exit China with Capital from these activities is strongly discouraged.
This is the full court press! China learned from the best.
The American System. Victorian England. West Germany.
China built what Europe forgot or, I suspect more depressingly, didn’t value enough to Protect: big factories, abundant skilled labor, many small firms, intense competition, ownership of the whole supply chain – the ingredients for relentless productivity gains and a population whose Wealth doesn’t have to be static.
I could be describing Birmingham or West Germany or the Midwest in prior eras. Sadly, I’m describing a totalitarian communist state running the West’s own playbook to perfection.
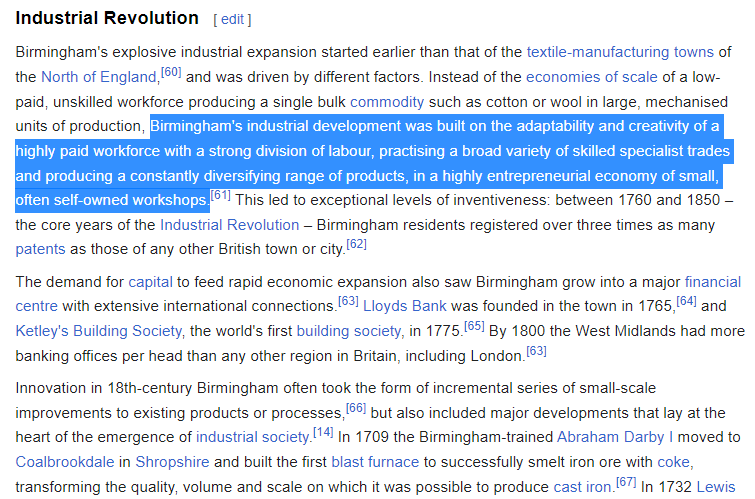
“Exceptional levels of inventinveness”, you say? Schoolboy histories of the industrial revolution are informed more by anti-industrial composers, journalists, and storytellers much more than by the actual historical record. source
Coincidentally, doing all this right creates significant downstream white collar services-sector employment as described in Birmingham above, circa 1775. All that production requires secretaries and bankers and lawyers in droves. If you’d like to guess what the effect of removing the underlying industry is on services sector wages and employment, take a walk round Birmingham next time you’re in England.
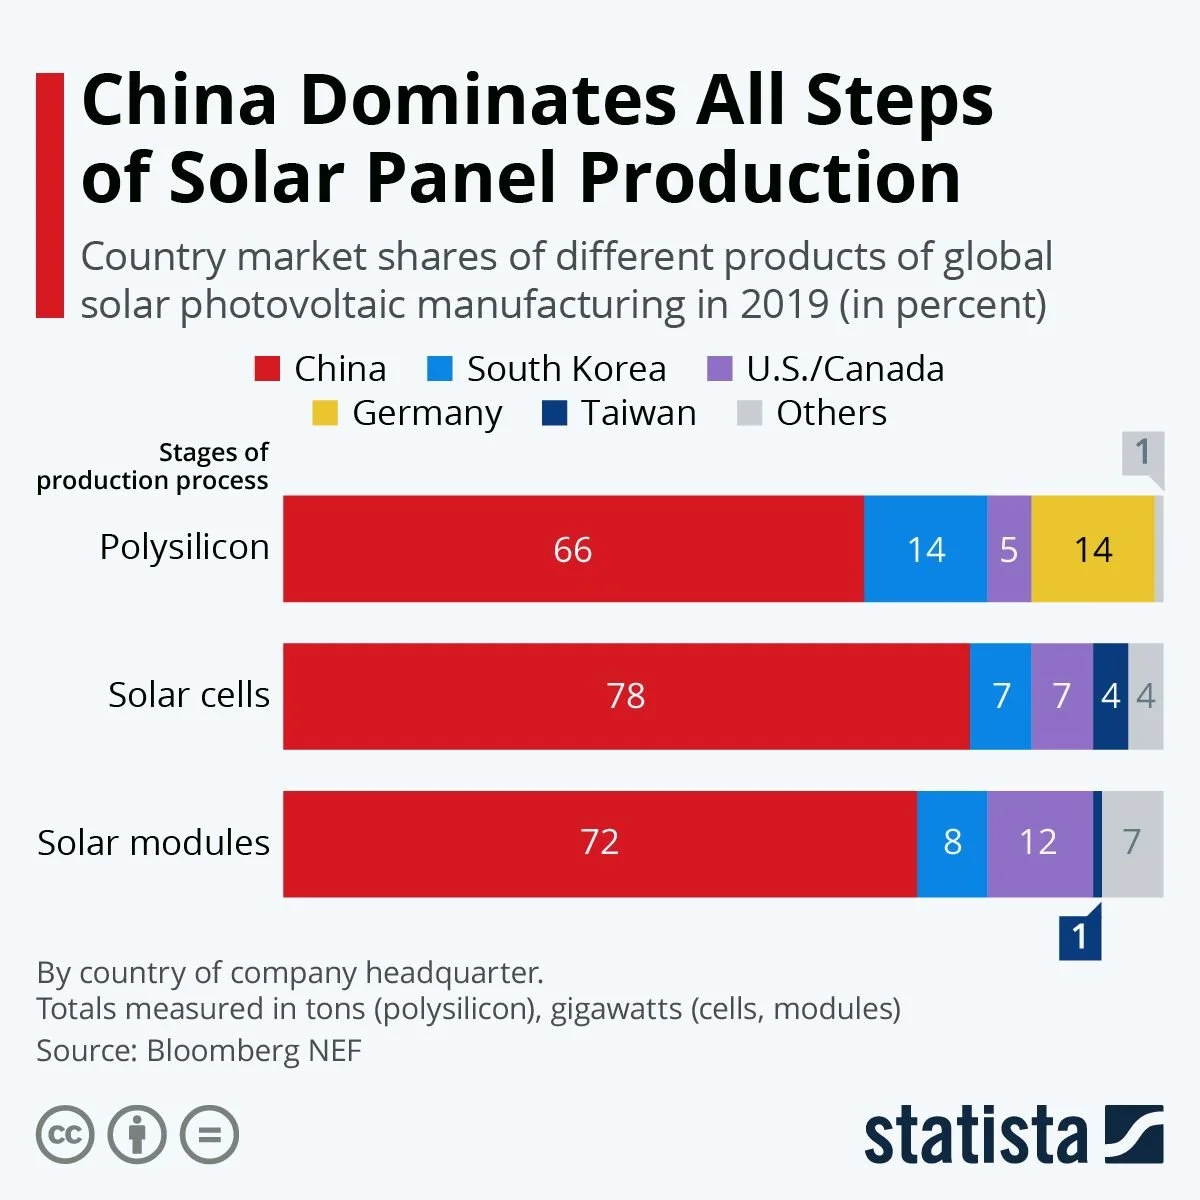
And everything in this essay is just a small slice of the industrial pie. Everywhere you look the playbook is the same. Solar cells? Europe and America mandate them! Who makes them?
Drones? The Call of Duty videogame franchise has been portraying drones as the kings of future war since 2014. You don’t have to be a jingoistic patriot to think there might be some national benefits to being able to produce 10 million drones a year.
Of course you know already where this is going:
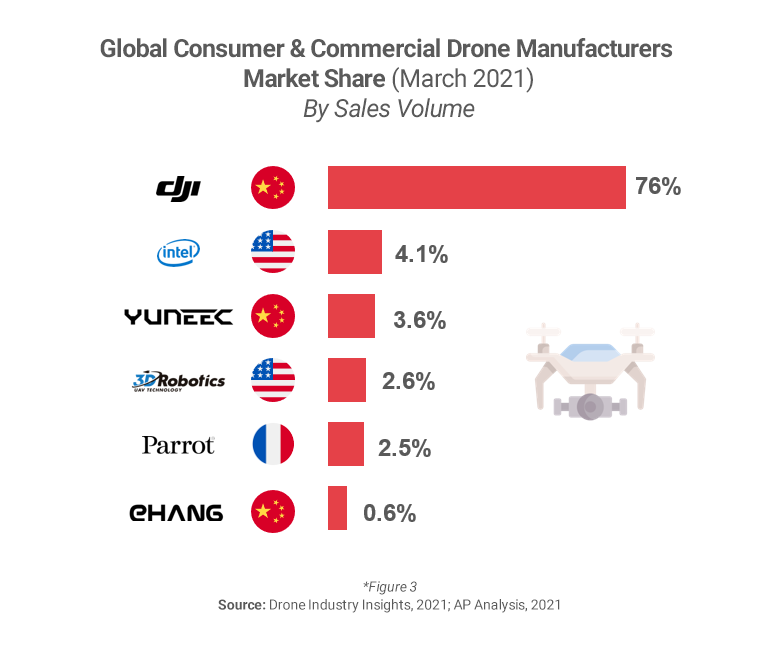
Smartphones? A microcosm of the Western model. Apple is currently the most valuable public company in the world, worth over $3.5 trillion — half a trillion more than the next biggest company. Apple directly employs 80,000 US workers. They understand enough of the political economy game being played that they have a whole web page explaining how many American jobs their Platform has created: 2 million!

But step back and think about the whole supply chain. How many people are directly involved in the iPhone manufacturing supply chain? 1.5 million. Why is the whole supply chain based in Asia?
This breathless 2007 WSJ profile of Foxconn’s founder is enlightening.
On his right wrist he wears a beaded bracelet he got from a temple dedicated to Genghis Khan, the 13th-century Mongolian conqueror whom he calls a personal hero.
"I always tell employees: The group's benefit is more important than your personal benefit," Mr. Gou says.
You have to read between the lines, but all the pieces are there — from company towns, to vertically integrated manufacturing, to artificially lowered tax rates, to a network of other firms providing subcomponents and raw materials, to infrastructure investments that lower the cost of transporting finished products to market.
You can’t possible compete against all this as a single private corporation!
Honestly, you’d be an idiot not to take advantage of it. In fact, it might even violate your fiduciary duty — and that would be a literal crime. Better to just take the money. No one will accuse you of mismanagement and you’ll probably get rich along the way. Don’t hate the player when you voted for the rules.
Contra “This Is Good For Us Actually” and “It’s Just Cost of Labor”
The Germany Shock demonstrates that you can still build industrial supply chains even in very high cost of labor regions, though they’ve fumbled the bag in more ways than one over the last decade.
But abstracting the whole top-to-bottom apparatus of corporate & government strategy designed to capture and retain economic surplus to a single variable — “cost of labor!” — is what the kids today call “cope”.
Apple just said they hope to move 50% of their iPhone assembly to fully automated assembly lines. That article says they’d previously scrapped those plans because the upfront investment costs would’ve been too high (how much cash do they have again? what do you think the CCP position would be towards Apple reducing employment at Foxconn? you think they don’t make that clear to Foxconn?).
For reasons that will be very obvious to readers of this essay, Apple has no plans to move automated assembly to America.
No. If automation is going to happen, it’ll be at the direction of a domestic firm. I know, I know, if you didn’t understand the CCP’s approach to industrialism it would sound conspiratorial — but here we are:

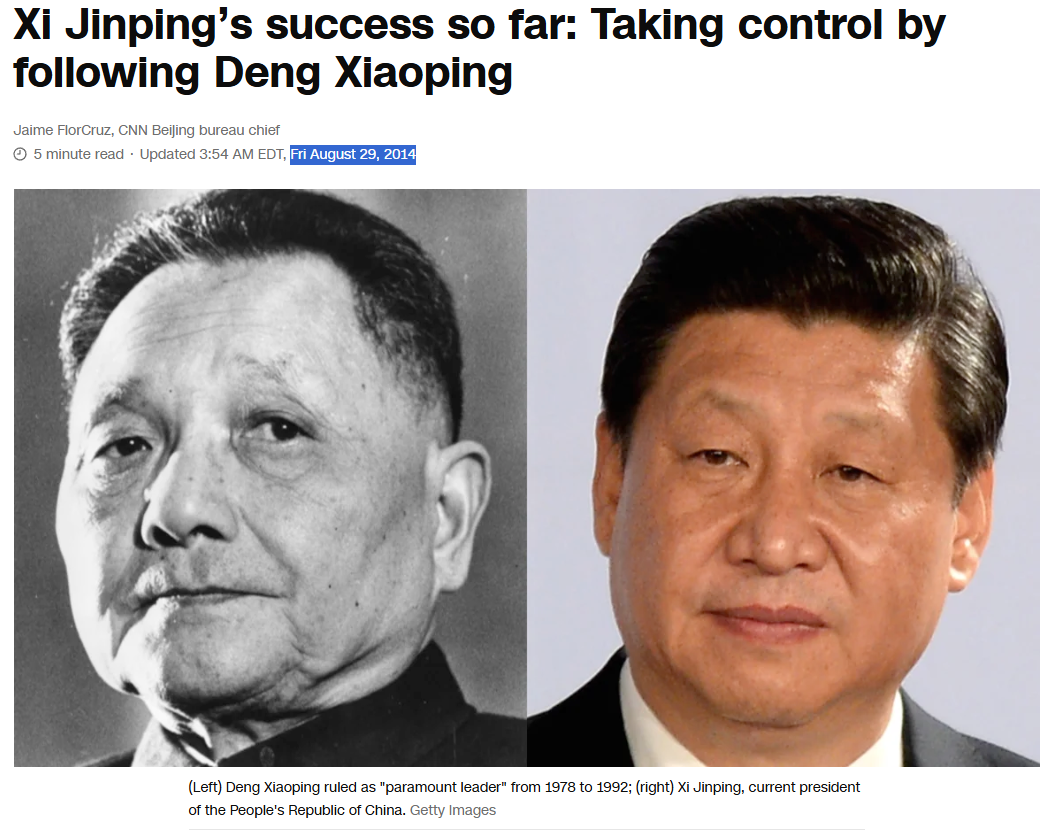
By analogy to smartphone manufacturing automation and plotting the course of industrial development over multiple decades: “But 1995 is when LG started investing billions into its Nanjing facility. And it had to ride the consumer laptop boom to be able to deliver the micro-mobility boom of the mid-2010s. And now, having delivered that, true next generation mass market affordable EVs are coming.” source
Automation happens in smartphone manufacturing when — and only when — the CCP decides it will be to the benefit of the CCP.
The Western cope — the soothing lie we tell ourselves — is that this whole setup is also to our own benefit. All the high-paying jobs designing, marketing, and selling these products remain here in America. Manufacturing supply chains are grubby, low-prestige, and low-pay. If China wants to spend its own human and financial capital to send us cheaper goods, we should thank them for it.
The irony is that for the sort of person who understands those arguments, they are true! People who can get a job designing an iPhone probably are better off in this system. Their equity appreciates (AAPL to the moon!), their labor is paid handsomely, and the goods they buy are cheaper.
But you share a polity with more than just those people!
The Lockean response to this is that all the other people are Tabula Rasas and they should learn to design iPhones too in order to have a path to greater personal wealth. But of course, not only are the philosophical and scientific underpinnings of the blank slate stuff too weak to build upon, the actual market for labor functions reasonably well. If the number of people able to design iPhones and Semiconductors increased by 3 orders of magnitude, the corresponding wages for that labor would decrease. The reason “Tech jobs” pay so well is precisely because of two beautiful facts: (i) how few people are needed to build Tech companies relative to the value they create, and (ii) how few people are actually capable of doing the work.

“Competition is for losers” applies to Labor too!
In contrast, building great companies in the real world inevitably requires involving more real people in the physical labor of the thing. Industrialism says to labor: “here is one of the most valuable parts of the economy, measured by enterprise value and systemic value creation — your labor is mandatory for its continued success, no college degree needed.”
This has predictable impacts on the balance of power between Capital and Labor.
It’s no wonder the communists understood these relationships between Capital, Labor, Markets, and Political Philosophy: they blew up their domestic economy so badly trying to subordinate everything to Labor that millions of people starved to death, after which Party Leadership decided — “it doesn't matter if a cat is black or white, as long as it catches mice.”
And now they catch all the mice.
You find the funniest stories online when you search with the benefit of hindsight (source)
Voters have preferences — mostly self-interested ones. You may think their preferences are wrong. But they want improving standards of living for themselves and their kids. If you can’t provide them through Capitalist mechanisms, they’re going to go looking for other options. And those options will almost certainly make things much, much worse for the remaining productive parts of your economy!
So you can stop them voting or you can make things better for them.
There’s no other option that results in a stable transition of power over the long run. Prosperity is mandatory.
As just one example, the majority of Western complaints about Housing are not actually about housing at all! Sure, your favorite city probably could have better policies. But the underlying issue is the path to personal wealth in a service-based economy demands you move to a handful of cities. If people could live elsewhere and still have similar economic opportunity, housing wouldn’t be such an issue. My barber cuts hair the same way no matter where he works — but he told me he moved to my town because the pay is better.
I see what I pay him and I agree that he made a smart choice.
An economy where the only options for non-elites to build personal and familial Wealth involve selling low-value-add services to elites will see the market power — the negotiating leverage and price setting abilities — of those non-elites vanish into the ether of various rents.
But an industrial Platform economy that builds valuable goods and sells them into a global market doesn’t have to set itself up next to New York City or San Francisco. The conditions necessary for success do not require a pre-existing hub of elites next door to spend money on you.
Your goods go on a container ship or a truck or a train and get shipped to the customer.
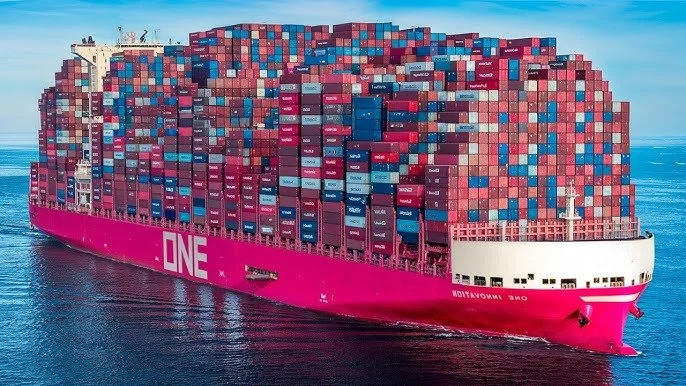
Pictured: economic majesty
Which means you can build your industrial hub outside of the corridors of Political power and Capital pools. Somewhere land is cheaper and jobs are lacking. The global trade networks built over the last 400 years are an insane blessing for non-elite labor: they lower the fixed costs of getting your product to market, increasing the pricing power your labor has relative to other manufacturing inputs.
Say thank you to the Brits — you don’t need to live anywhere near your customer now!
But if you’re just a service providers….that’s not true. You have to live next to your clients.
If everyone else does too, your landlord gets much of the benefit from your labor.
And then the people doing that labor vote for something easy to understand that might make their lives better.
You probably won’t like what they pick.
The “cheap” answer to why it’s worth trying to maintain a domestic industrial base is that the wheel of time could turn and History Could Restart anytime — and if we have to get involved in a shooting war with a peer adversary, it would be nice if we could make our own munitions.
I think that answer is okay.
It’s not wrong, and more people appreciate it now than they did 5 years ago when we didn’t have a land war in Europe. But it’s not compelling!
People want to better their lives. They want things to improve! Telling them they should put up with even less because you might need them to fight and die for you in a war someday down the road is a bad pitch! It’s an even worse pitch after a century of running domestic campaigns to reduce nationalist fervor in the West.
The better answer, but the much harder one to understand and explain and convince anyone of, is that sometimes — not always, and certainly not if you don’t commit to it — but sometimes you can actually end up with more in the future by paying for it upfront.
Industrialism can in fact have a positive Return on Investment.
The Logic of Capital: Why Innovation Capital Makes America Great (But Hates Investing In Hardware)
Having just spent 3,000+ words talking up China’s strategy to produce Wealth for its population across the whole socioeconomic spectrum, I feel like I have to take a quick break to explain what makes America so great — and why it’s heavily at odds with the American System Chinese model.

Full summary of The American System available via email, courtesy of Zephaniah Chang
American innovation is responsible for enormous amounts of the technological progress whose actualization then occurs in Chinese factories[see Note 0].
But the way America prefers to fund the actual corporate entities that grow up to become mega cap tech companies is through private funding. Those funds in turn source capital from an array of external Limited Partners. To the extent there are any government-related funds in the system, they are not directed by actual government representatives.
Sure, Silicon Valley’s backstory does involve a rather more direct government link, with Fairchild Semiconductor’s primary original customer and source of funds being the Department of Defense.
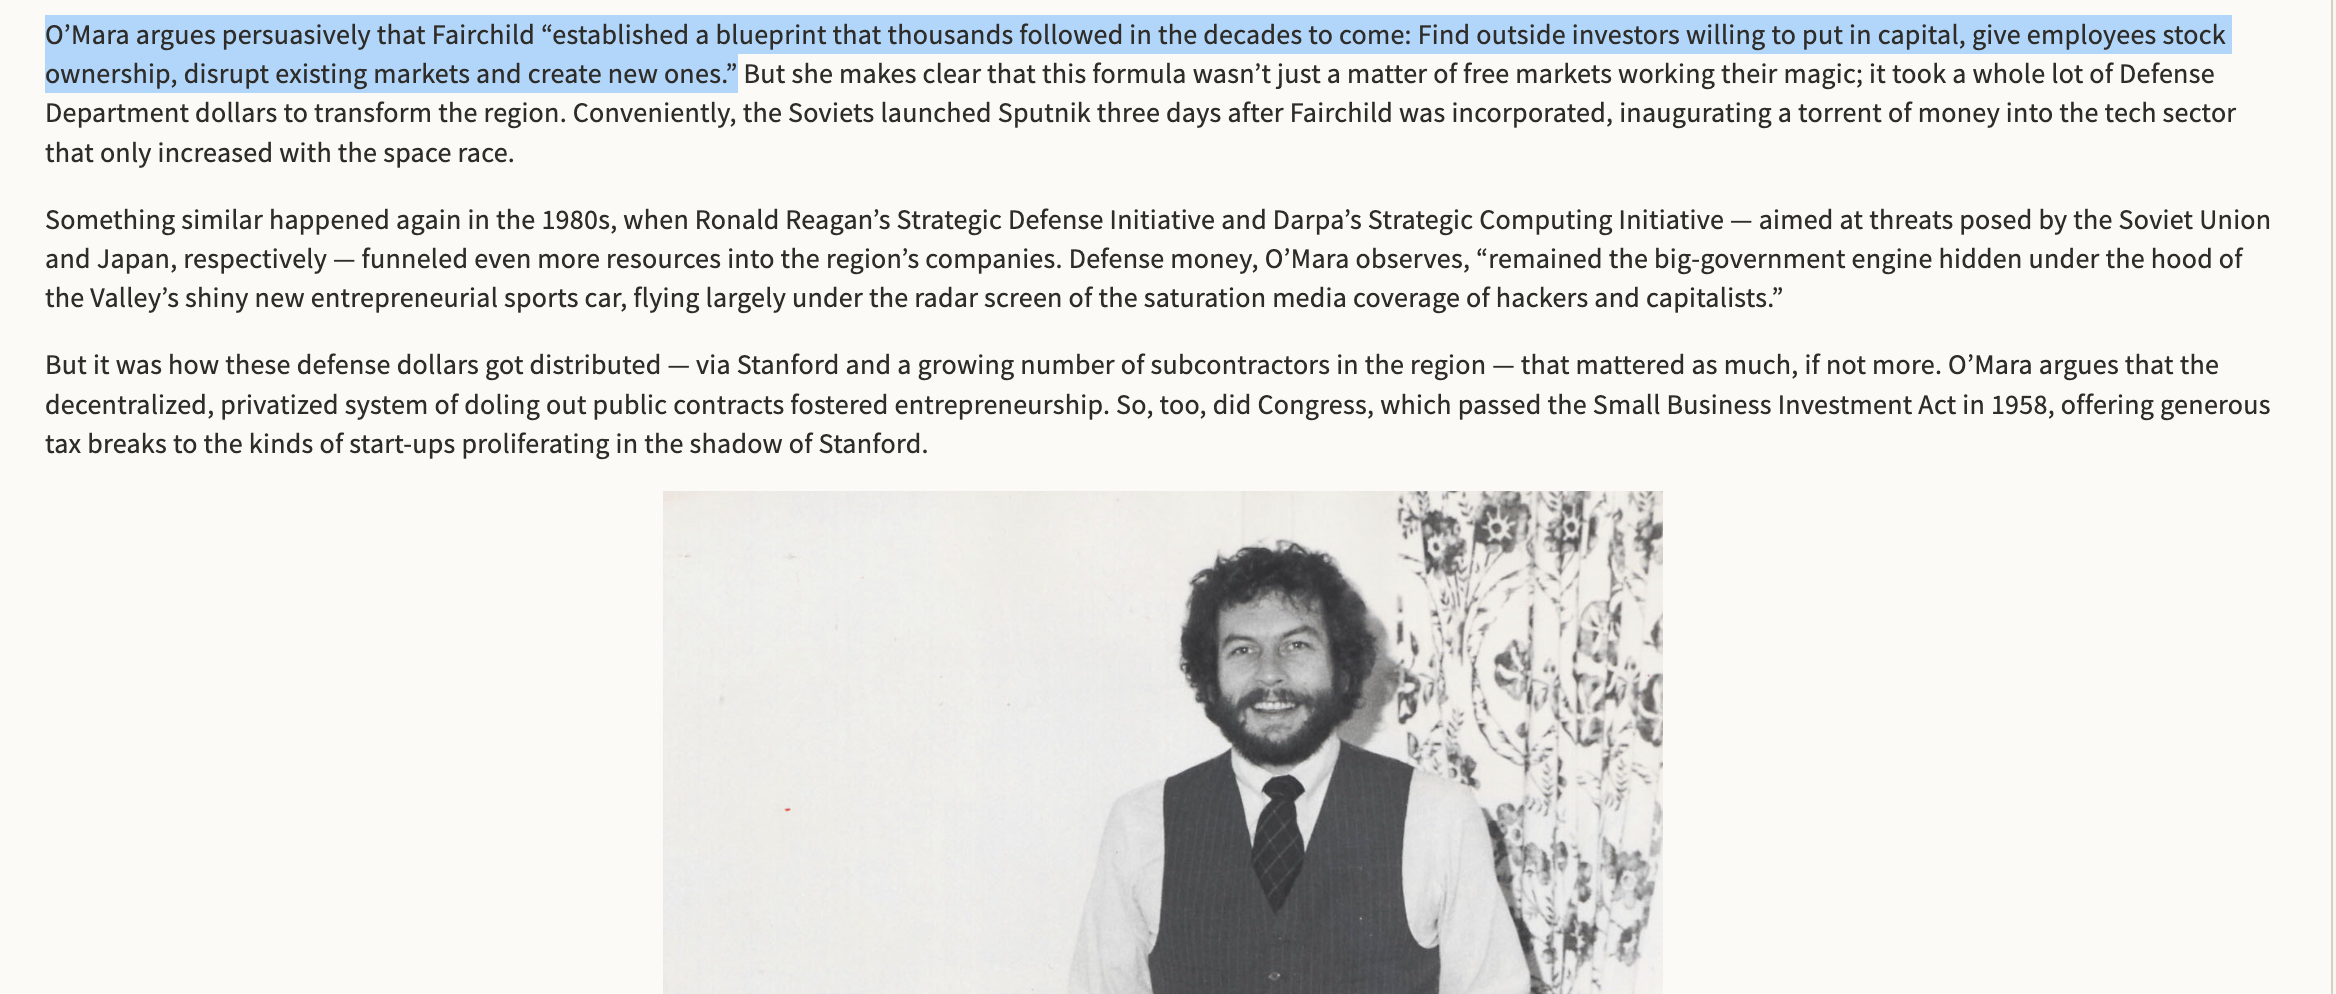
And yes, it does turn out that linking government, academia, and corporate interests in a single location with (at the time) a low cost of living is an incredible way to kickstart a regional ecosystem.
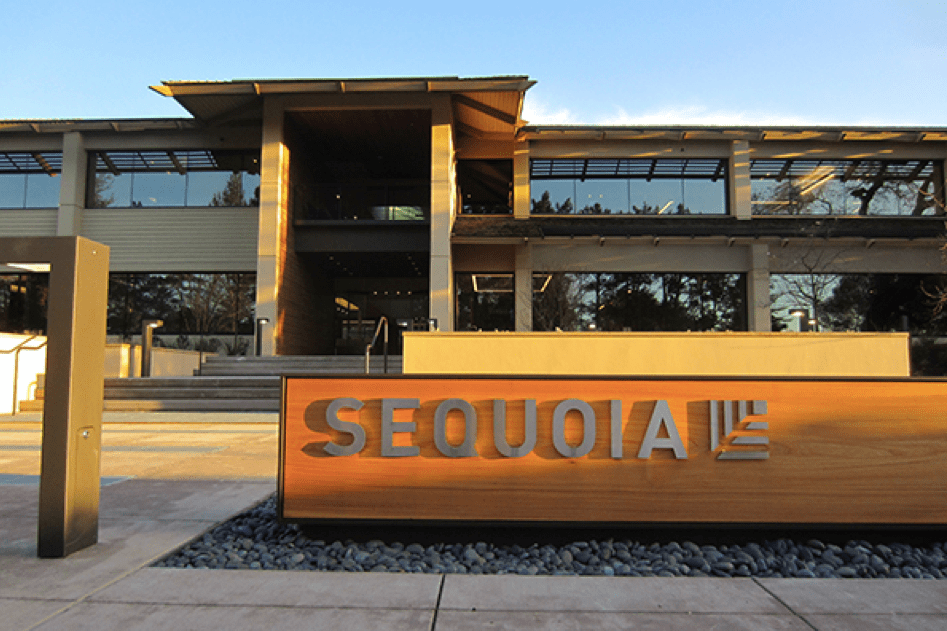
But today, there are two primary channels for private funding to spur innovation in America.
The first — responsible for the storied “144 characters” — is by having a small group of investment professionals manage a large pool of capital. They then get paid a ton of money if they can grow the pool of capital.
The second is by having megacap companies run an economic surplus repeatedly and then invest that surplus in things that might make their products better. My essay on Monetization and Monopolies explores how we end up with less innovation when these companies lose their profits.
If you’re a Marxist you can use the phrase “the logic of capital”, or if you’re an economist you can refer to the law of rent. But no matter your preferred ideology, the mathematics of both of these innovation channels is the same: Capital must flow to the places it grows the fastest.
Firms who choose any other strategy will, in the long run, underperform versus peers and see their funding dry up.
You want a nice office building? You better not be choosing investments with return profiles far below your cost of capital!
Remember above in the section on Electrification when I noted that Semiconductor performance was doubling 8x faster than Battery performance?
The inevitable result of a core technology growth rate gap that big is many more opportunities to invest in things downstream of semiconductor performance than batteries.
You get 144 characters instead of flying cars because for ~40 consecutive years the majority of capital invested in new high-growth business formation was allocated into things built on top of semiconductors, based on the gap between expected future growth rates and the cost of capital.
If you want the flying cars too — which in this case is a metaphor for Electric Vehicles — you have to be willing to sink an enormous pile of capital upfront into a lower-growth industry. And then double-down on it repeatedly until it achieves sufficient scale to pay you back.
With the recent explosive success of its tech scene in global markets, China shows that you can actually have both high Tech high IRR startups and a thriving domestic industrial base — but note that while each individual firm may be critical to the industrial platform’s functioning, not every equity owner has the same return. You might have the idea, capital, knowledge, and team necessary to build the next generation EV company — but you still need the industrial platform around you to make it work.

Final words of a hardware startup CEO before going bankrupt: “Yeah man, I’m the hardcore industrialist from American myth. Me vs. the world. Let’s gooo!” [sidenote: if this is actually you, excuse my cynicism and know that it’s directed more at the logic of capital than your own efforts — feel free to email me to talk work if you like, I’d be happy to connect you with anyone in my network who might be useful]
I want to seriously ask readers with some mild financial literacy to imagine raising hundreds of millions of dollars of other people’s Capital in 1995 and then telling your own investors that your plan is to take all their money and spend it aggressively on machinery and labor to build a brand new battery manufacturing company to compete with entrenched giants. The margins are slim. The upfront costs are enormous. Profits are expected in 2-3 decades, if ever. In order for this ever to be a good investment, someone else will need to invent something called a “smartphone” in 15 years time. Oh, and by the way, your buddy is going to do the exact same thing on a city block next door to you.
Also, the local government doesn’t really like you and some of your workers will try to unionize and you’ll be taxed before making profits.
OR: you could take a tiny fraction of that same pool of Capital and use it to found Amazon ($2 trillion market cap), eBay ($32b market cap), or Netscape (acquired for $4b within 3 years).
You’d have to be insane.
Selling goods and services over the internet at near-zero marginal cost to an ever-increasing pool of online users is an incredibly good business model. So good, in fact, that we’re still coming up with new permutations of it 30 years later. We left the terrible business models of “actually using labor and machines to assemble finished product” to the misfortunate capital allocators who lack access to this goldmine:
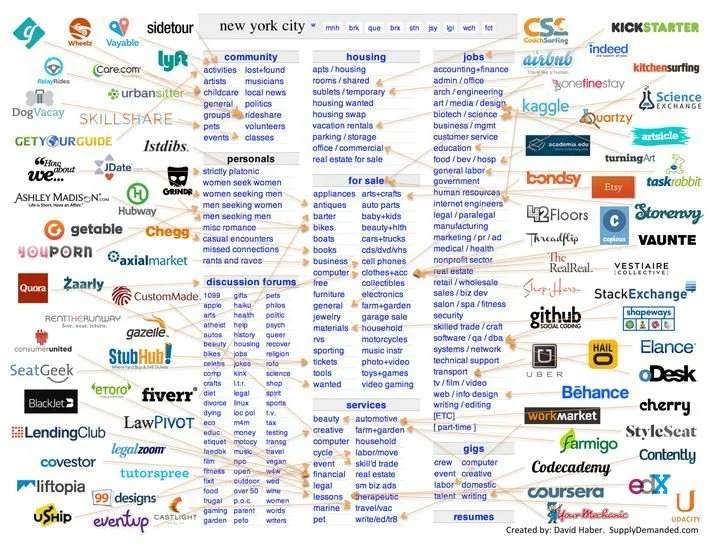
Each business here built on the unbundling of Craigslist is valuable in so far as it offers a software-based way to capture value from users (“leasification”) at massive scale. source
The American system is the best on Earth at sourcing free Capital from anywhere in the world and then allocating it to the highest-potential RoI activities permissible within our borders.
Sometimes even to impermissible ones.
But the existence of that system necessarily raises the hurdle rate on all other investments.
Over the long run, repeatedly choosing a 5% rate of return when you could’ve instead chosen a 20% rate of return will actually make you poorer than when you started. You will lose the ability to raise funds. People will choose to work with others. Your comparable metric is not “CPI inflation” — it’s “expected cost of capital,” which is determined by the performance of your peers.
Don’t fall behind.
You can imagine how good all the lines on the charts look when your system is the best at turning $1 into $10! This common sense analysis is at the root of the economics that explains why it’s good for America to make this trade repeatedly for decades. But it’s a system destined to break when its gains separate from its citizens. Optimizing for equity outcomes benefits equity holders. This drives the bifurcation between old and young, rich and middle, successful and not successful.
The appropriate class-based response to this obvious bifurcation for someone like myself is either (i) explain to the not-successful that it sucks to suck, they should’ve tried harder in school, should’ve had a firmer handshake, should’ve eaten less avocado toast, etc., or (ii) signal my pity clearly and vocally for the tragic-but-unsolvable plight of the unsuccessful and advocate for a legion of policies on their behalf that fund jobs for my peers and our kids disbursing funds ostensibly to help…but whose inevitable outcome is to reduce industrial competitiveness wherever we go, eventually shrinking the number of available jobs for the people we pity.
Unsurprisingly, I find both of these copy-paste-tier responses to be inadequate.
“Okay Conrad, but this American system funded Tesla and that’s clearly the company that led the EV industry into the next era. U-S-A!!”
Sure. So ask the question: how was Tesla funded?
And the answer is simply that Tesla would’ve died in the 2007-2009 crisis without ever shipping a car if not for a single insane man throwing all his personal cash into the company:
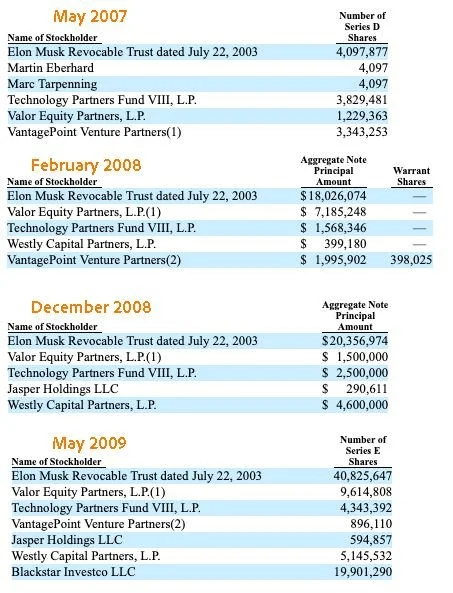
source & explanation (look at the relative magnitude of who’s putting money into each of these funding rounds)
Elon Musk has become an incredibly polarizing figure since this happened. I don’t care to discuss his insanity in other venues in this essay. But I think his actions with personal capital during this period truly defy the “logic of capital” — he demonstrated absolutely no risk function and outspent institutional investors by an order of magnitude with his personal capital. This was irrational. Insane. This stuff is so far outside the norm that it should recontextualize all subsequent behavior.
Founding a company usually requires some amount of insanity given the expected odds of success — and that’s when you’re using other people’s money to bankroll things! But plowing all of your personal funds into an industrial manufacturing firm pursuing a novel product using new manufacturing techniques in a high cost of labor market was ruled economic suicide by every rational investor.
It’s to America’s benefit that Tesla exists.
But the systems that fund innovation here would not have saved it.

Pictured: texts from a founder friend. An exaggeration, of course. But do note that your hardware pitches will be a LOT better received if you have a software layer attached to them. Software we understand. Software you can turn into a service and sell repeatedly.
As for the second method of allocating capital — Tech megacaps — Apple has over $150b in cash & investments. Google has $130b. Microsoft has $90b. $370b between them. But all that capital is still held to the same standards, the same law of rent, as everyone else’s capital. If it’s going to be spent on anything at all, its risk-adjusted rate of return has to be higher than whatever else it could possible be doing.
$370b dollars stuffed in mattresses T-bills says: this is a much safer way of shepherding capital than anything else we could be doing with it!
And they’re right!
Because as I’m trying to show, building a successful growing industrial engine that employs or supports meaningful shares of regional economies is a bigger problem than any one individual firm can solve.
Why on earth would any rational actor light their capital on fire investing in factories when there’s generational wealth lying on the table for them to take, so long as they play along with the incentives set up for them? Why would anyone invest in multi-decade low-margin foundational hardware manufacturing when the returns will likely be captured downstream by other equity holders?
The logic of capital says you’ll lose your job, your fund, and your reputation if you do any of that. Invest in hardware? Have you seen the margins? Have you seen the returns? Have you seen the TAM? Have you seen the limited ability to capture repeat revenues from customers? Don’t be insane. The American system has one goal: maximize capital returns.
Ask yourself: which statement sounds crazier? The S&P500 goes to $10k? Or $1k? In your heart, you too believe in American equities.

Nobody can make a number go up like us! source
Tariffs Can’t Save You From All This
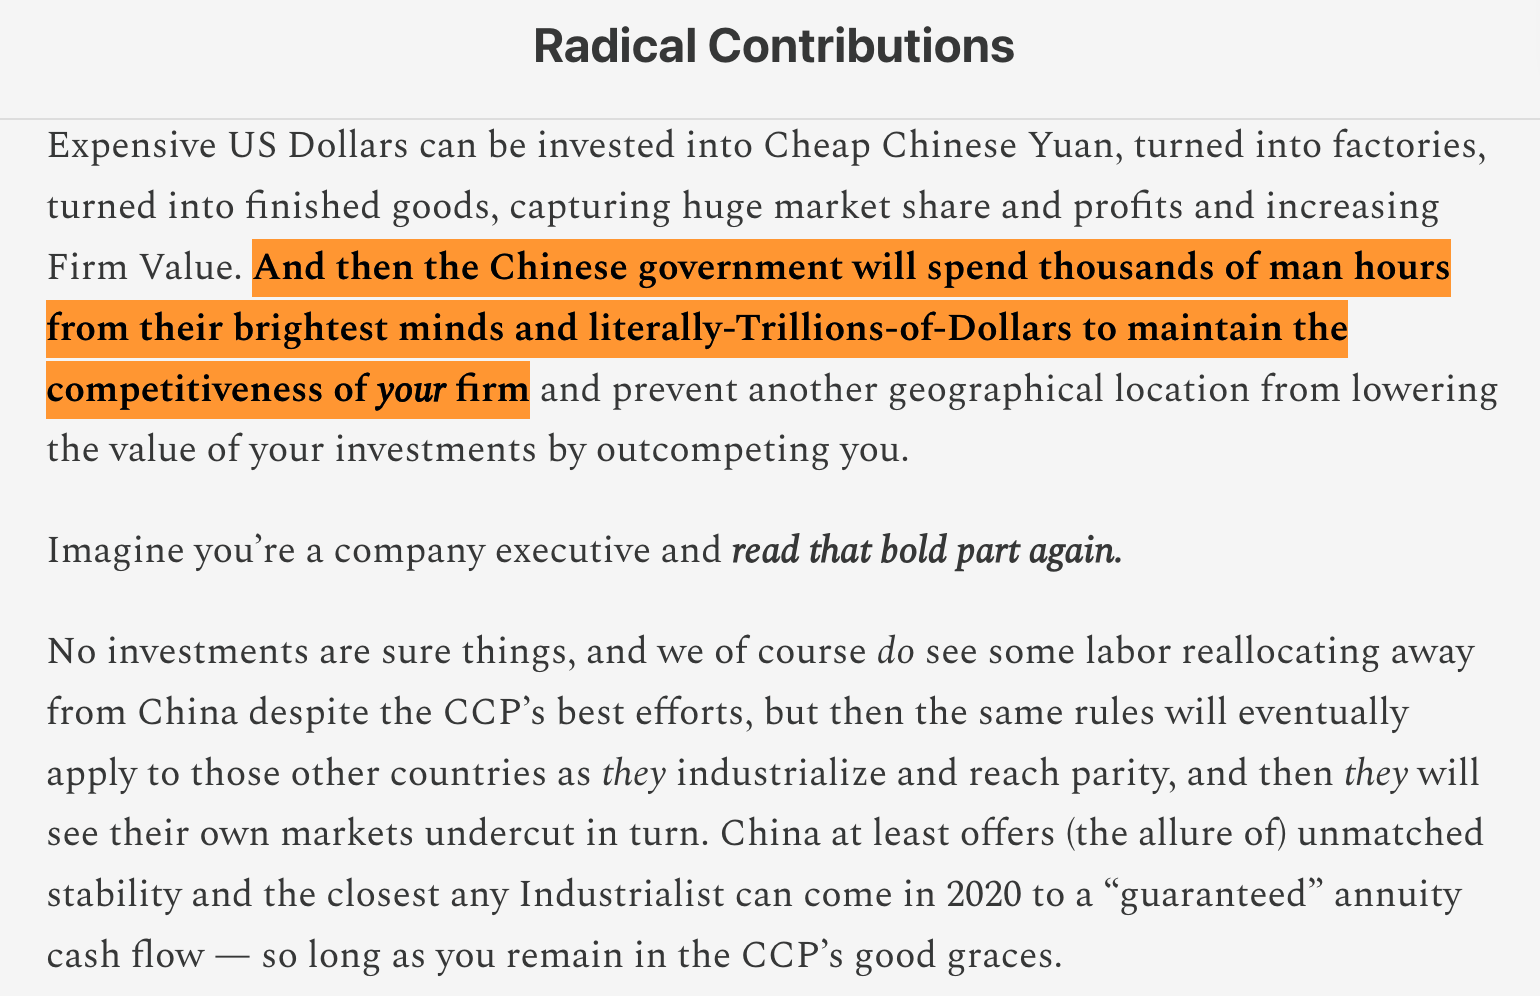
In 2020 I was focused on a different part of the industrial puzzle: The Currency Problem.
And my point 5 years ago was that you might be able to light a few sparks by playing with just one piece of this playbook, but to a certain degree global manufacturing success IS a zero-sum game. In any given year, there are only so many dollars available to be spent on finished goods. If you just run this playbook half-heartedly, you’re still going to get rinsed by China and the end products your consumers buy will be more expensive.
The tariffs are literally just punching yourself in the face. Economically-speaking.

Despite the sparks, none of these trees caught fire. (source: The Germany Shock)
On my 4-hour podcast with Lorenzo, he says at one point that some of my writing almost provided a defense of some of Trump’s tariff-driven economic policy. I deflected a bit at the time because you have to be careful not to accidentally endorse polarized figures when you’re trying to make nuanced points, but he was somewhat right to note that none of my work presents a rejection of the Pro-Tariff Pro-Reindustrializing economic position.
To the extent that that “making your whole society wealthier” is a worthy goal to strive for, integrating as large a share of your population as possible into the production of value-added goods is a really, really good strategy for any democratic society. And doing so doesn’t require a crazy never-before-seen playbook.
But Lorenzo was also right to note my skepticism towards the 2016 administration.
If you’re going to play this game, you have to play to win. That was the conclusion of my piece on Germany. You can’t just play half-heartedly. You’re going to get smoked AND your consumers will be made poorer.
The standard economist line is right, generally speaking. Opening Pandora’s box on this shit is a bad idea. You’re probably not dedicated enough. You’re probably going to change priorities in 4-8 years — you’ll likely change administrations! You’ll barely move the needle on reallocating productive jobs to your own nation, and you’ll only end up raising costs for the end buyer. Maybe you should just give up. Maybe it’s fine to let someone else capture the whole value-add chain. If you’re reading this, your kids will probably get into a good enough college that they can have a tertiary services job anyway — and everyone who doesn’t make it can just be supported with taxes on the wealthy and increased government debt.
Embrace the European solution!
Or maybe that last paragraph made you mad and you think people who talk to their readers directly using “you” in essays are hacks (sorry).
I think winning is good. Yes, I do like positive-sum games and think everyone should strive to play them wherever possible. But I don’t think there’s anything morally wrong with winning a game someone else has to lose. If we’re going to play those games — and whether we wanted to or not, the rules of the jungle have at least forced others to play them against us — I prefer to win.
I’m not trying to advocate any one specific policy here — just a frank articulation about the actual game being played and whether we are serious about playing or not. Do you care about making your people wealthier? How much? My analysis is that Europe is so unserious about playing that it borders on a violation of the fiduciary duty between government and people.
America is better positioned. We don’t have to play.
But we could.
The tagline on my essays is “Building great things.” I joked earlier about a serious newspaper whose top stated mission is to improve the overall supply chain of a given domestic industry being unthinkable to Western audiences. But I had 50+ wonderful comments on my essay on the origins of heightened criminality in Western cities and not one reader connected the dots from there to everything else I write about.
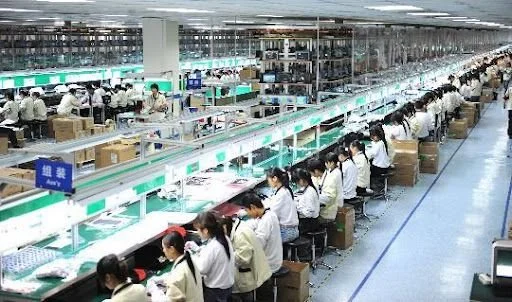
Each of these people is doing final assembly on an iPhone — do the mental math on hourly wages vs. the value of the tiny thing in their hands
You think we can build a dynamic regional industry of interconnected firms & suppliers, each of whom moves a warehouse full of valuable inventory on any given day, without shockingly low levels of crime as the background?

“Hey ChatGPT, remind me which years Birmingham experienced its exceptional inventiveness & industrial growth? 1760-1850, you said? Fascinating, fascinating. Anyway, I notice a spike in homicide rates around 1960 or so…” source
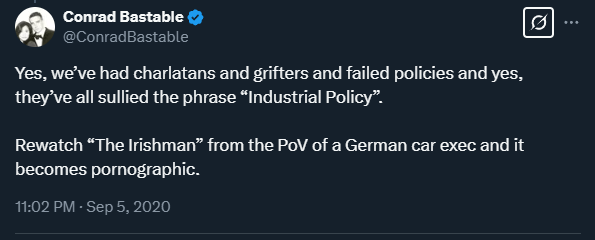
One of my running bits is that The Irishman is a bad movie but a great documentary.
Watch it to understand, in small part, American deindustrialization. You cannot run industry when high crime and low social trust is in the water. Local crime raises the cost of doing business. If you make 90% Gross Margins slinging bits over the internet, the ultimate impact of regional crime on your profits is perhaps limited to the increased cost of housing in safe parts of town driving up employee wages and difficulties getting people to come in to the office. You can deal with that.
But if your margins are 8%? You’re toast.
Tariffs aren’t going to solve any of this for you. Not in isolation. They can definitely cause some industrial investment to reallocate. They can even manage to do so in ways that are net positive due to the network effects of manufacturing and the increased productivity of low-skill labor on the margins. This is made even more true by the interaction of socioeconomic bifurcation, wage growth, and prices.
However, tariffs are just one part of a national strategy committed to domestic wealth building. If concerns other than enriching the domestic population ever take priority — and you can see how reasonable it would be for a nation like ours to occasionally have other priorities! — they’re going to undermine the work tariffs are trying to do.
So that’s my pitch. You don’t have to concede the whole game. Technological progress, innovation diffusion curves, differing rates of return on invested capital, unequal total addressable market sizes across industries, and the stickiness of trade routes are all factors that say: you can actually play this game and win!
But the meta has evolved over the last 50 years.
“Industrial policy” is a fool’s label, just as much as “company strategy” is. What’s the best “company strategy” for any given company? Whatever wins. The metas evolve. You can’t study this stuff after the fact — anything that worked long enough ago to make it into a study is unlikely to work now! People write the “tell all” books only when their tactics are no longer relevant.
What’s the best “industrial policy”?
Do all the things that matter and none of the things that don’t.
Good luck.
Notes & Related Musings Cut From The Main Essay
[-1] The longer version of the story of battery improvements over the last 30 years:
Battery improvements driven by consumer electronics and early EV manufacturers made micro-mobility (scooters) totally viable in the early to mid 2010s
Tesla famously made its first battery packs by stacking cost efficient consumer laptop batteries together
The same batteries can be found in Ninebot scooters today
End-product sales growth offset the cost of industrial capacity buildouts and justify continued investment, further lowering per-unit costs
E.g. South Korean conglomerate LG has invested $8 billion building out 10 different corporate entities employing 30,000 people in Nanjing’s technological development zone and driving $18 billion of “total output value” across the supply chain in 2023
A flywheel of sales, profit, and Capital reinvestment funds technological improvements though direct corporate R&D, indirect academic research partnerships, and tertiary incentives
Regarding tertiary incentives, a massive entity nearby offering direct research opportunities and an attractive quality of life will tend to push more students into undergraduate programs studying the hard sciences, even if only a small fraction actually end up working at that explicit entity
We get positive feedback from centralizing industrial capacity across multiple firms, capital inflows, employment opportunities, R&D, etc. etc….and all of that goes into making end products that are dramatically more attractive to consumers.
Which means more sales, more profits, more investments, more capex buildout, more R&D funded, more more more!
[0] A One Firm Narrative About The Death of Industrialism, Job Loss in New Hampshire, and Higher Stock Prices
(if I was a better writer, this story would be the introductory narrative for this essay instead of a footnote)
The recent story of electric scooters is actually its own incredible microcosm of this whole thing.
Segway Inc. invested in early innovation around electric-powered micro-mobility. Their devices never found product market fit and — in keeping with the theme of this essay — they were not well supported by a rich ecosystem of domestic industrial manufacturing and component suppliers.
Mismanagement and failed product adoption left the company in a bad spot. It sold in 2010 to a British millionaire. Less than a year later, the new owner died and the company was stranded in a worse spot. American investment firm Summit Strategic Investments bought it for just $9m in 2013. Summit talked to local New Hampshire newspapers about planning to “expand its worldwide network”, but a year later filed a formal complaint with the United States International Trade Commission alleging multiple Chinese firms had been infringing on Segway patents.
The cynic in me suspects this was always the investment case.
18 months after filing suit, Beijing-based Ninebot agreed to acquire Segway for $75m. Not a bad turn around for Summit! $9m to $75m in 2.5 years!
A few years later, all remaining US-based employees are laid off and the New Hampshire plant is closed.
In 2019, Segway-slash-Ninebot makes a major investment in e-bike manufacturer Sur Ron.
And we come full circle back to this essay, with Segway tech improving the bikes that dominate the UK market in 2023.
Your patents? Infringed & irrelevant. Your jobs? Moved to somewhere that values them. Ahhh, but your consumer products? Affordable & high performance! And your equities? 8x’d!
Yeah, sure, an American investment firm turned $9m into $75m by suing over some IP before the American jobs were axed. But the combined Segway-Ninebot company just did $2b of revenue in 2024.
Don’t get me wrong: Segway never had any hope of competing here. Its best hope really was as a collection of unactionable Intellectual Property. That things ended up this way is likely for the best for the company given the background economic environment. I’m sure the people employed in their American facility found something more productive to do. And even if not, my local Five Guys here in New Hampshire pays over $20/hour. That’s over $40k/year!
But note that the way this plays out across every industry is that Americans get higher equity prices and cheaper goods, in exchange for increasing the bar necessary to build Wealth. Is it any wonder college tuition is so crazy and the rent in a handful of major cities is so nuts? Five Guys or Big Tech, those are your bifurcated choices. Below the API or Above it.
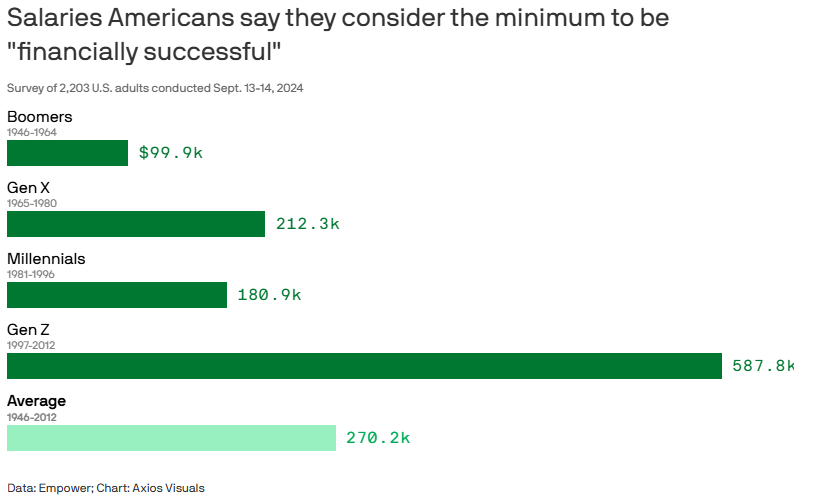
“The kids are not alright” is a meme as old as Ancient Egypt. But these attitudes around wealth represent a marked split from prior generations. The “kids” today believe they need to make $600k/year to be successful. Also, they do not believe the current system offers them a broadly accessible path to making $600k/year. How do you think those two things are going to square? You’d be a degenerate crypto rug-pulling gambler social media hustler too if this was your future. source
The instinctual democratic response to this bifurcation of outcomes for citizens is for one political party to offer to “crack down” on those “evil rent seekers” who’ve successfully passed the higher par and seen their personal fortunes accelerate, while the other party condemns those left behind for not working hard enough, not scoring high enough on the SAT, not having the right connections, and for having the temerity to expect handouts!
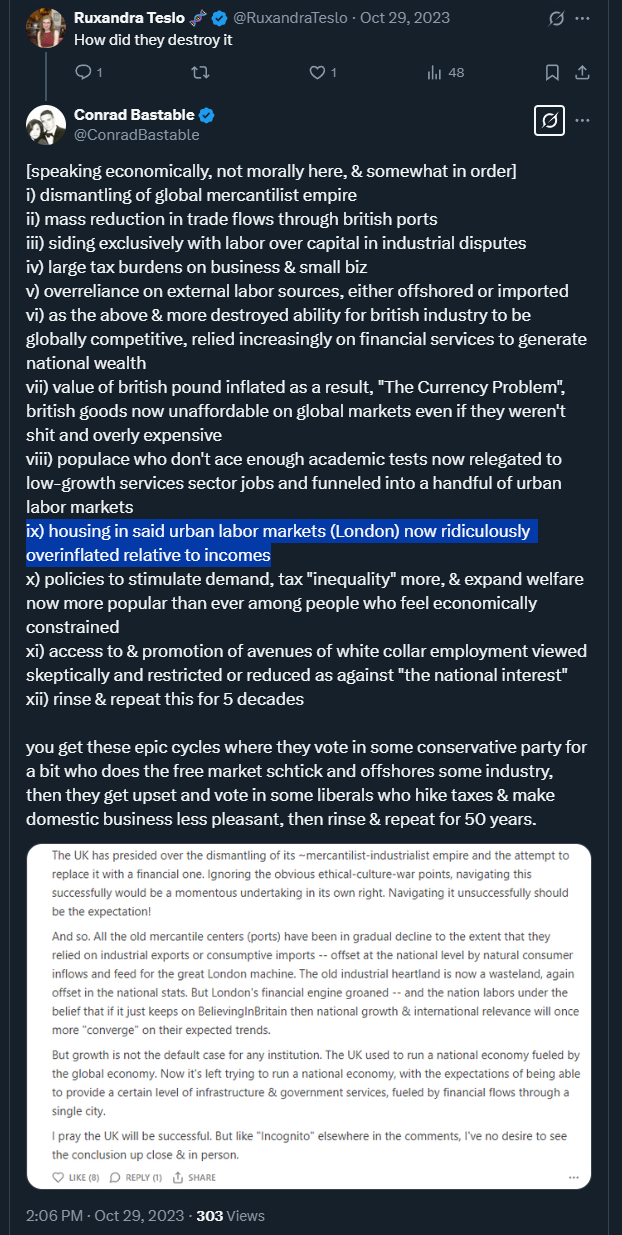
If you’re curious how the doom-spiral of ping-ponging between these two extremes plays out, please, consult Great Britain:
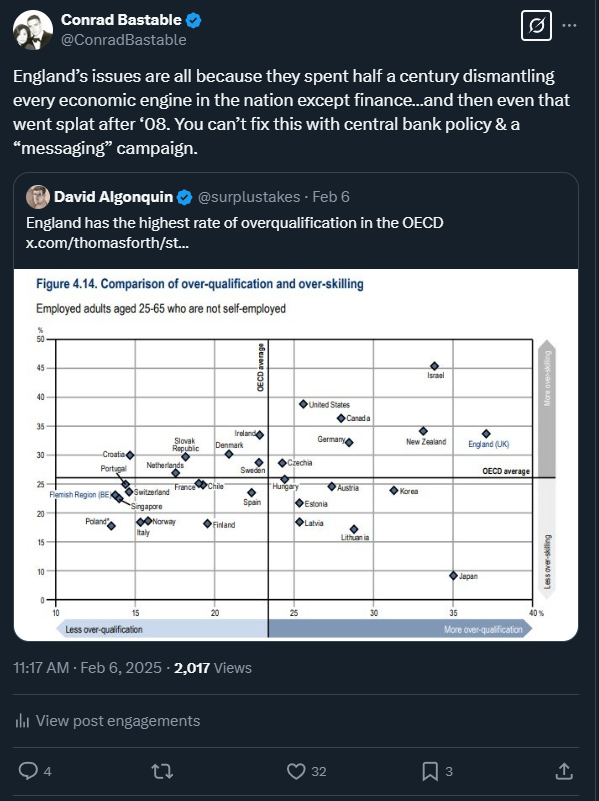
And after all the arguing is done, look around and ask: are we winning?

[99] On the Role of Democracy In Accelerating Or Retarding Industrial Growth
One of the core issues with pursuing some of the strategies outlined in this essay in the West is that the whole plan can be compromised by losing an election that happens every 2/4/6 years — and your geopolitical adversaries know that!
This is part of what makes our system resilient to autocratic overreach and improves democratic support for the state. It is a good thing. But it is also undeniably a weakness against an adversary who can put a plan into motion in 1995 and keep executing on it for 30 years straight.
That doesn’t make it wrong! Every system has strengths and weaknesses. But don’t let love of our own system lead to delusions about its weaknesses.
It’s easy to mistake my respect for China’s achievements as wanting to emulate their system here. Nothing could be further from the truth. I’m an Anglo American individualist who loves his culture and the philosophy and values it’s created. I think small agile units working in loose tactical harmony but with tight strategic alignment create more aesthetically beautiful victories than combining all forces into a single crushingly powerful monolith.

Pictured: Trafalgar, 1805 — somewhat of an embodiment of these values
But the current moment has an eerie feeling about it. American global hegemony is a thing of the past. Our secretary of state acknowledged it plainly this year:
So it’s not normal for the world to simply have a unipolar power. That was not – that was an anomaly. It was a product of the end of the Cold War, but eventually you were going to reach back to a point where you had a multipolar world, multi-great powers in different parts of the planet. We face that now with China and to some extent Russia.
This is the opinion of the White House and therefore its intelligence agencies. It’s been part of my writing since 2018. Anyone who can mentally model dynamic systems changing over time has been able to see the writing on the wall here for a while now.
The thought of missiles and a shooting war naturally draws all the attention in the room. But the economic side of things goes under-discussed — except in the context of escalating tariffs and pointless twitter arguments about whether or not they work.
What’s eerie about this moment, in 2025, is that the West is responding to domestic pressures by increasing the level of autocracy it practices and experiencing weakening democratic support for the state. The very things our system mitigates compared to China’s.
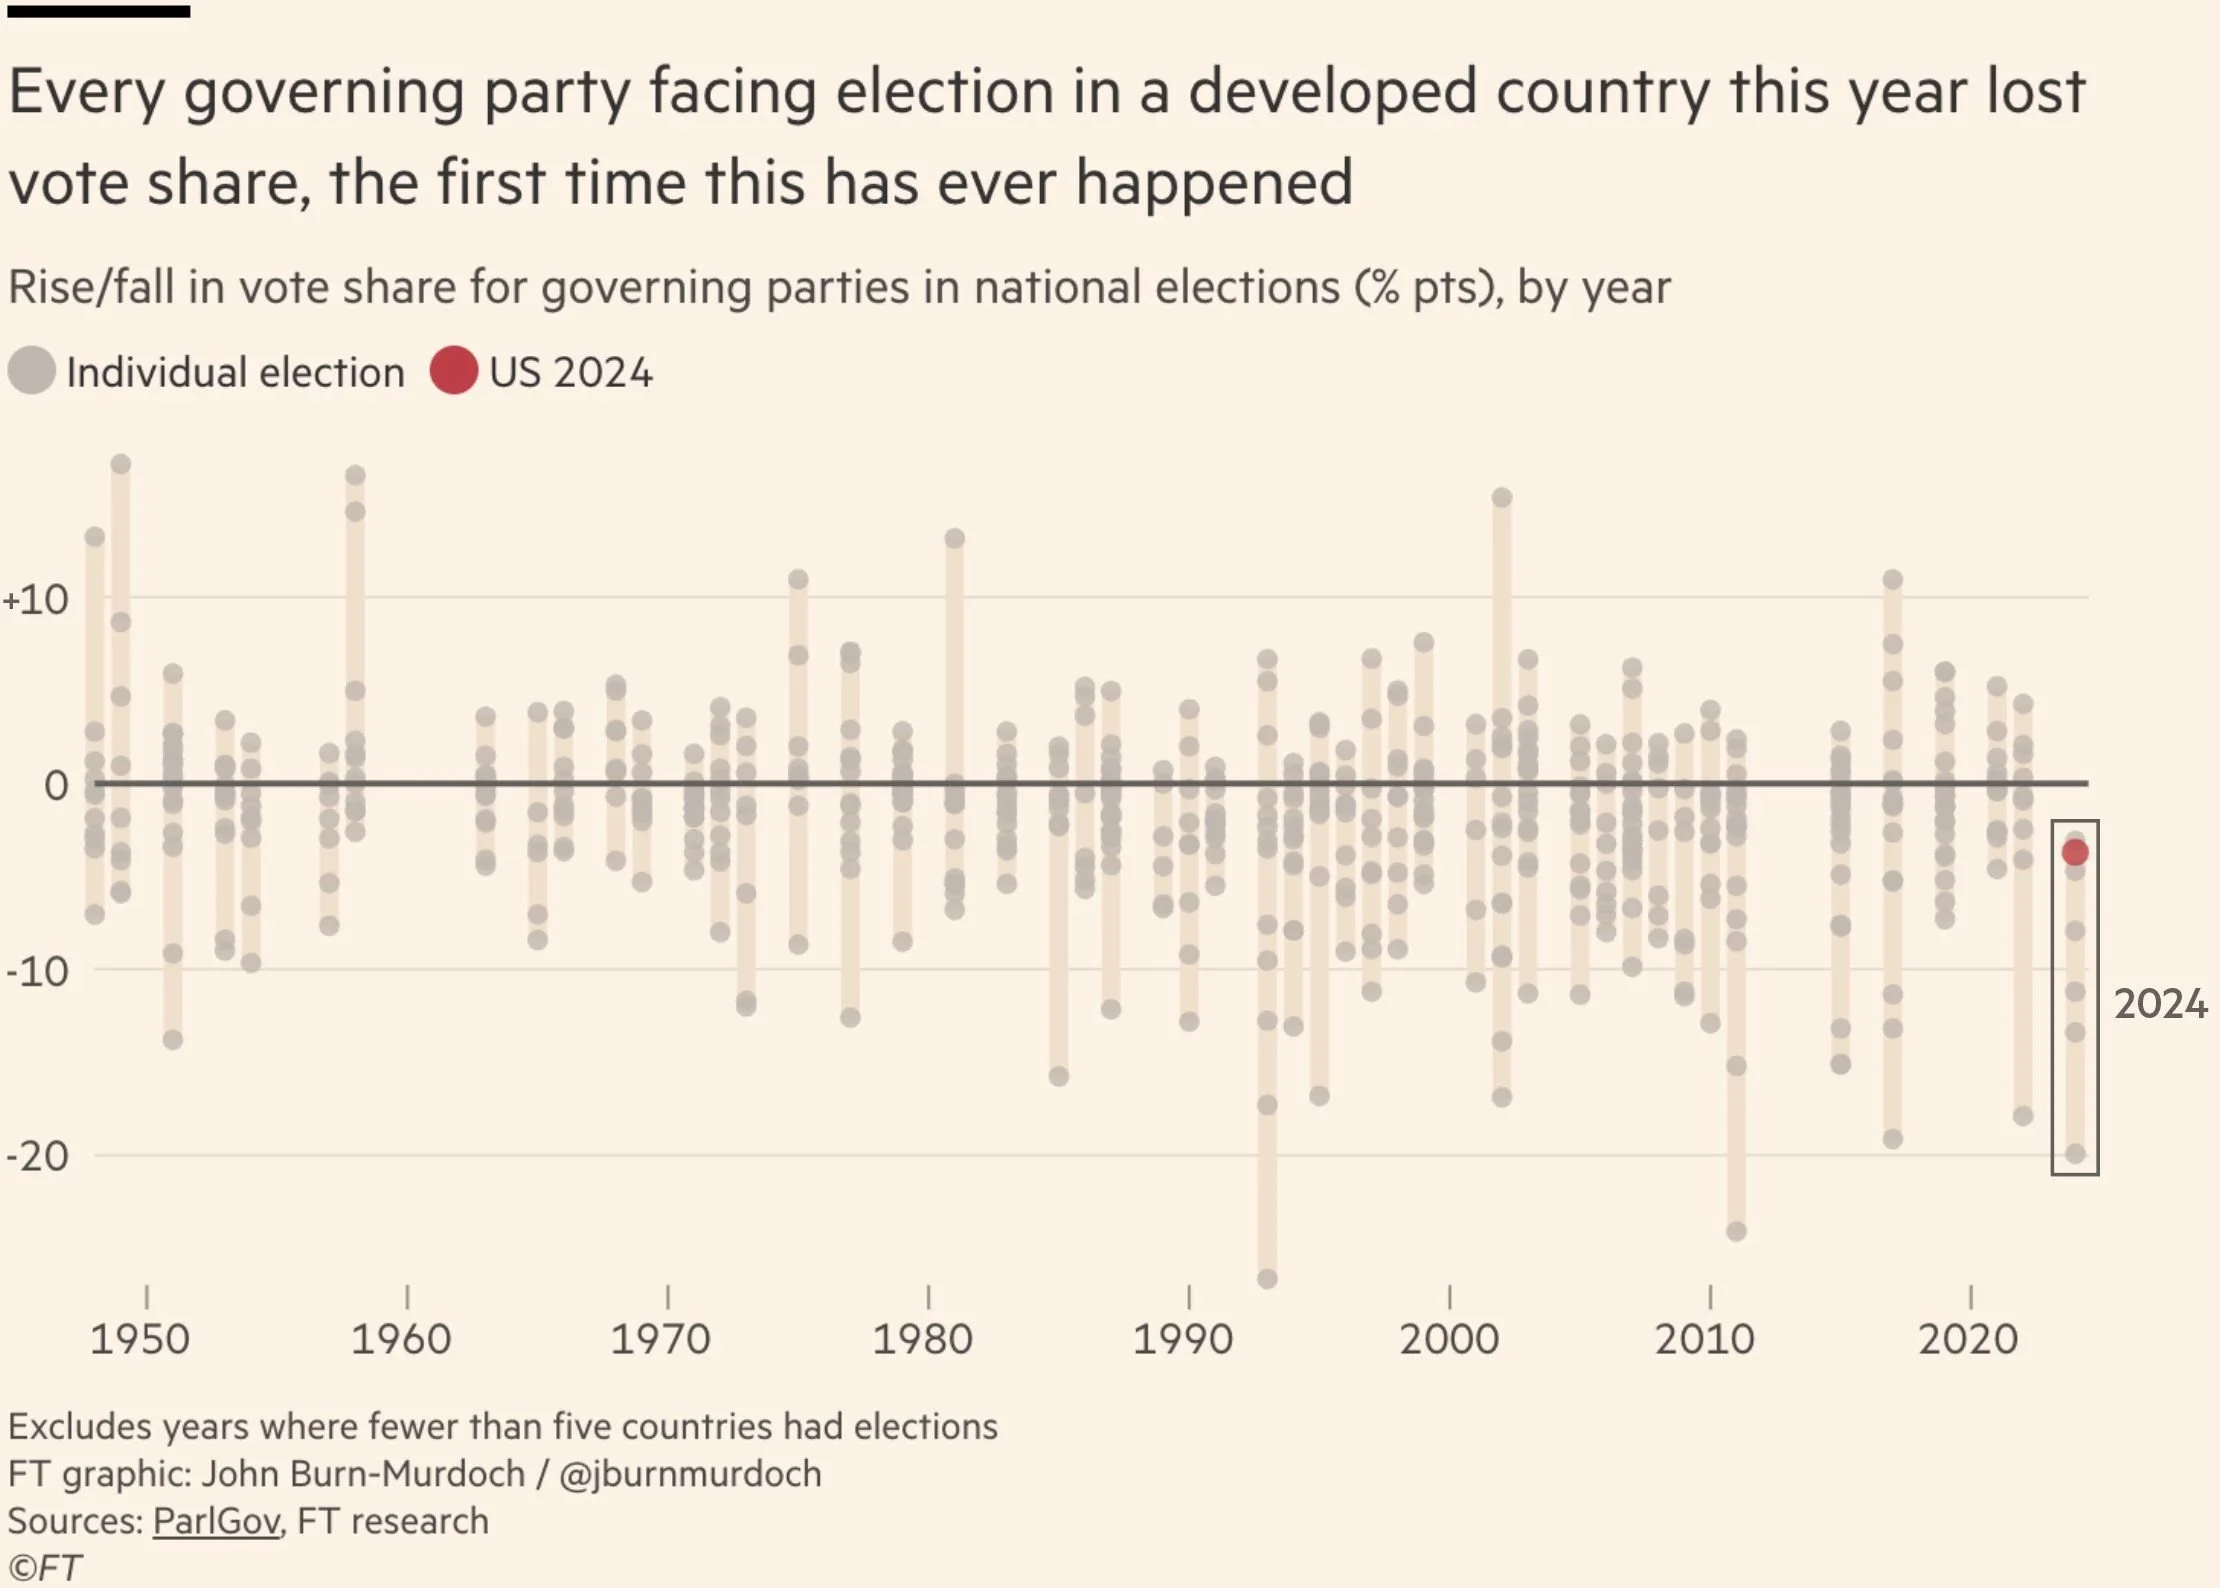
source: “What the Year of Democracy Taught Us”, Financial Times
Of course partisans for one party or another in any of these nations might object to my framing — “we didn’t do any autocracy! Everything we did was necessary!”
Litigating that level of the Culture War in writing is beyond me. I trust readers who’ve stuck with me to the bottom of this footnote can follow my logic that, regardless of the incumbent party in question, from the advent of covid through to the present, the West has opted to exercise an increasing amount of centralized power over its citizens.
If you think these things were good in some cases, know that I will happily grant you any of them instead of arguing about it.
Nonetheless, we’re still dealing with the economic fallout of the corona-crisis, 5 years on.

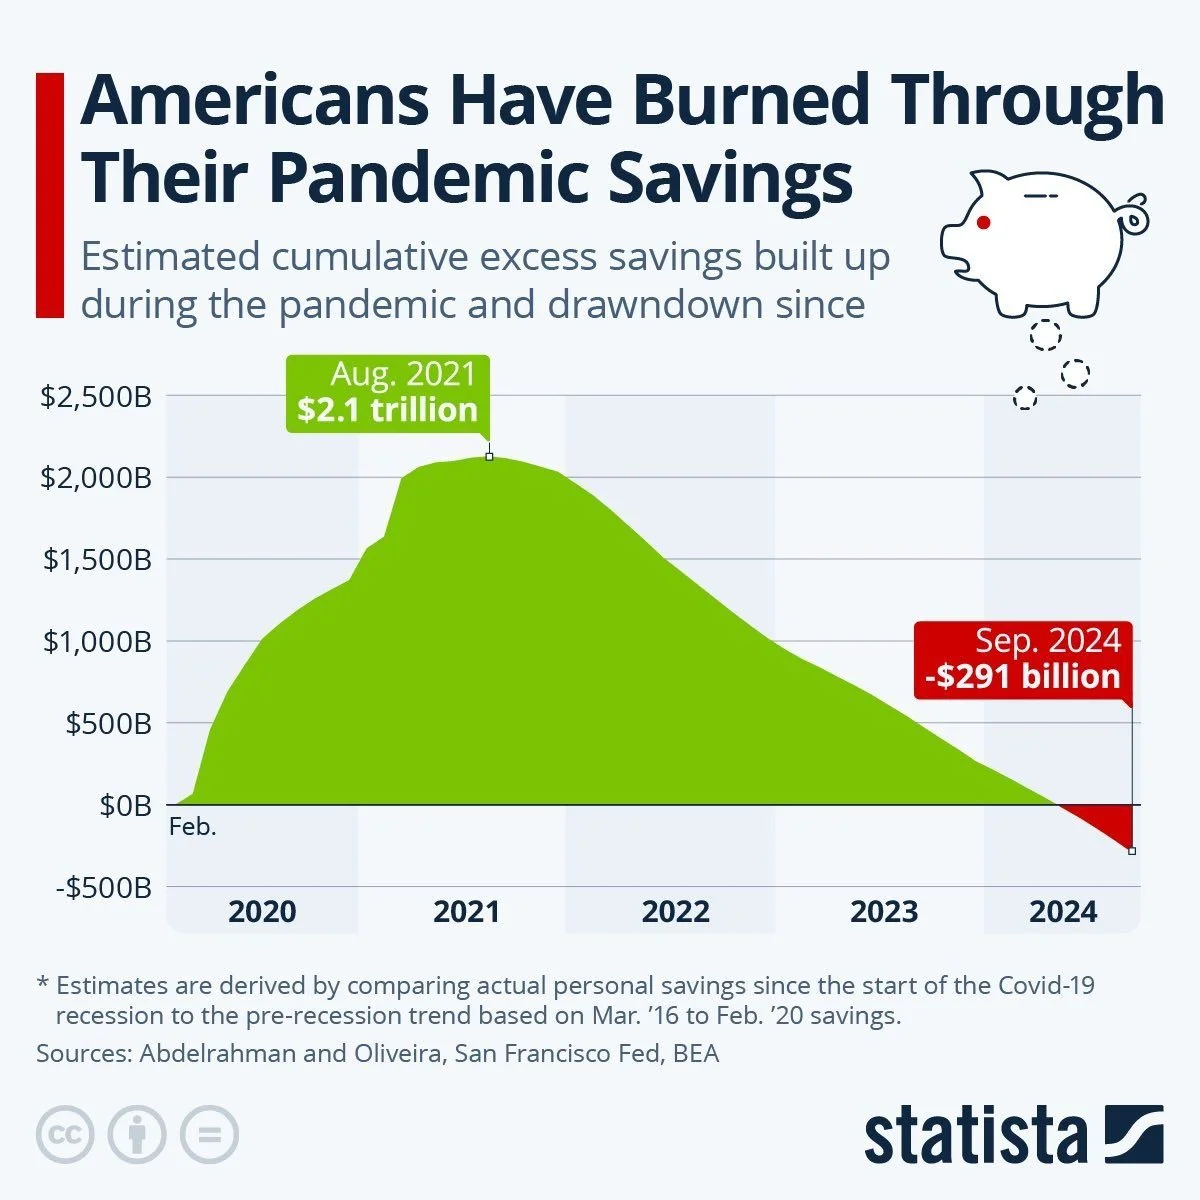
In my own mental models, almost everything that matters is downstream of underlying economic causes. And I suspect that the potential (American) or inevitable (European) loss of economic optimism primes the people to be more hostile towards their elite institutions — including political ones.
“If this shit isn’t working, we’ll kick it until it does.”
And that hostility breeds a natural reactionary response from said elite institutions.
“You don’t even know what’s good for you. Do what I say.”
The opinion of many smart philosophical liberals who actually know how markets work is that Western values were responsible for unleashing the powers of modern capitalism and ushering in a period of tremendous growth. I think that’s a really neat story. I’ll probably tell my son something like it as he grows up.
But the shadow of that story is that it gets the causality wrong. The independent wealth of the North West European middle class was what enabled their philosophies to evolve into a coherent and functioning state.

As with all things, the truth of the matter requires integrating both the idea and its shadow.
The culture helped create the wealth.
The wealth accelerated the adoption of positive cultural technology (e.g. contracts, courts, joint stock corporations).
That cultural technology made the people more amenable to a liberal state based on similar frameworks.
The broad involvement of the middle class in economic production then supplied a large pool of independent & self-interested manpower to vote for, staff, and direct that state for the purposes of mutual self-betterment.

The mercantilist Europeans yoinked “laissez-faire” from the Chinese after beating them up in trade relations — 300 years later, our economists now preach laissez-faire to Chinese mercantilists. Ironies. History is a circle.
What this realization then implies is that changes to the underlying economy of the demos — the way they work, their relative wealth vs. the elite, the Course of Honors to elite status, etc. — can change the sorts of cultural technology that a democratic nation built on top of them is able to use.
Regardless of what I would like to happen — “while retaining all of our Western cultural values, we seamlessly & instantaneously transition to a world where much of global industrial production happens in vertically-integrated industrial hubs in the West, involving and benefiting large portions of the local population even where much of the actual assembly work is automated, such that productivity growth and wage growth recouple somewhat for individuals in the 25th-75th percentiles of earnings and counterproductive value-destructive policies stop being championed by both leftist & rightist demagogues, ultimately reducing the economic leverage that a totalitarian communist regime has over global affairs” — the question of how things actually resolve, and whether or not it’s possible to move the needle in a positive direction, remains.
I don’t think my vision above is particularly likely to come to pass. It would be nice, but so would many other things. Getting from here to there would require hitting so many reset buttons with such vigor that the system would likely crack before reforming. That’s okay. The alternatives on offer in reality are not “utopia” and “hell” — merely different levels of imperfection. I don’t write this essay to advocate for some vision of utopia. I write it because there are people currently attempting to throw a wrench at the system with the hope of changing it, directionally, to look more like the utopia I describe.
And, for many reasons outlined here and in the footnotes of other essays, very few smart people have engaged seriously with what this might look like over the last half-century in the West. We have forbidden it explicitly and implicitly, because its likely end-state is nationalistic competition. Nationalist competition in the West has a somewhat recent and very tragic backstory that we make sure to tell our children both at home and at school.
Regrettably, this has not stopped China from playing.
As with my notes on foreign currency exchange rates, the people who most value stability are those currently at the top of any given hierarchy. It shouldn’t be surprising that China aspired to climb the international GDP/Capita ranking table.
What I think would be most tragic of all, and this is where the European and British cases are instructive, would be to ultimately forsake the philosophies and values of the West without actually improving the underlying productivity and Wealth of the our people.
If we forsake some of what makes our culture special, but do so in service of things that don’t simultaneously increase domestic productivity and involve a greater share of the domestic population in those new gains…the inevitable ruin that follows will be well deserved.
On the one hand, I’ve buried this in a footnote instead of its own essay because it feels omnidirectionally blasphemous to say in the current environment. To endorse any sort of state capacity industrial policy is to invite the scorn of every “proper-thinking, well-socialized” economist in the nation. To critique the strategy of "throw some blanket tariffs on the barbeque to see what cooks” is to invite the enmity of those hoping to curry favor with the current administration.
On the other hand, I think engaging earnestly with this topic provides a coherent definition of “good statesmanship.” This is also its own petty blasphemy. But I would happily opt into a world where leaders are judged purely on the impact of their leadership on the household Wealth of their citizens at the time their administration began. Certainly it appears that the CCP is more sensitive to this measure than Brussels. Extremes are of course bad, but perhaps this essay might cause a few readers to wonder if we ought to move a little further towards the “Wealth-maximization-focus” end of the spectrum.
I hope to convince at least a few readers that abandoning Principle AND Prosperity is the worst trade of all. I honestly believe a strong case can be made for pursuing each of the other 3 quadrants (slotting today’s nations into each quadrant is left as a fun exercise for the reader). You can keep your Principles, but abandon Prosperity, and still end up with reasonable domestic outcomes. You could keep Prosperity but abandon Principle, and hey, at least you can wipe the tears away with all your money.
But to throw both away? Tragedy.
In the meantime…the logic of capital owns the souls of all individual Americans. We can each only do the best we can, given the system and incentives around us, to:

Thankfully, I don’t have “write Substack essays for a niche contrarian audience that simultaneously attempt to convince anti-tariff-market-purists that Tariffs are good, while also attempting to convince pro-tarriff-industrial-realists that Tariffs are laughably insufficient” as part of my own personal plan to Get Rich or Die Tryin’. This is quite genuinely just my own “special interest”, as the kids say. If you read this far, please subscribe or write a comment or tweet at me or send me an email, even just to let me know what parts you took issue with. My end of the writer-reader bargain is that I promise not to publish unless I have something interesting & meaningful to say. If I’m upholding it, you may not agree with all of my perspectives, but ideally you come away from each essay with a newer or richer framework to think about what it means to build great things.
- Globalism Keeps Kosher
- KTM Case Study
- Electric Dreams
- European Self Sabotage
- Protectionism Without Production
- Losing To Sur Ron
- The Dragon’s Forge
- Contra "This Is Good For Us"
- The Logic of Capital
- Tariffs Can't Save You
- Notes & Musings
- Job Loss In New Hampshire
- Democracy's Role In Retarding Industrialism